

UGI (UGI) Reaffirms Guidance And Declares Dividend After Loss As Undervalued Case Holds
UGI Corporation UGI | 0.00 |
UGI (UGI) is back in focus after reporting third quarter 2026 results that combined a net loss from continuing operations with reaffirmed full year guidance and a fresh quarterly dividend declaration.
UGI’s share price is US$35.26 after a 1-day share price return of 0.46% and a 7-day return of 2.86%. Even so, the stock is down 6.30% year to date, while the 3-year total shareholder return of 77.64% contrasts with a 5-year total shareholder return that is slightly negative. This suggests that longer term momentum has faded even as recent moves reflect shifting views on earnings resilience and risk.
If UGI’s mix of regulated utilities and energy exposure has you thinking about what else is moving, it can be useful to broaden your search through the 36 power grid technology and infrastructure stocks
For UGI, the recent uptick comes after a quarter that mixed a loss from continuing operations with steady guidance and a fresh dividend. Is the share price echoing the business fundamentals or a mood change in the market?
Most Popular Narrative: 14.7% Undervalued
UGI’s most followed narrative puts fair value at about $41.33 per share, above the last close of $35.26, which frames today’s price as a discount.
Divestitures and regulatory wins fuel earnings quality, financial flexibility, and fund investments in grid modernization and renewable energy projects.
Operational efficiencies and growing distributed energy solutions drive margin expansion, customer growth, and improved free cash flow.
Want to understand why this narrative sees more value in UGI than the current price suggests? The story leans heavily on compounding earnings, steadier margins, and a future valuation multiple that is lower than many utility peers. Curious which revenue and profit assumptions have to hold for that fair value to make sense? The full breakdown sets out those drivers in detail without leaving much room for guesswork.
Result: Fair Value of $41.33 (UNDERVALUED)
However, this UGI narrative still faces real tests, including long term pressure on fossil fuel demand in Europe and ongoing customer attrition at AmeriGas.
Another View on UGI’s Valuation
While the analyst narrative sees UGI trading below a fair value of $41.33, the SWS DCF model paints a very different picture. On that approach, the stock price of $35.26 sits well above an estimated future cash flow value of $14.29, which points to UGI as overvalued instead.
The gap between these two methods raises a practical question for you: Which set of assumptions about UGI’s future cash generation feels more realistic given the company’s regulated utility exposure, capital needs, and slow forecast revenue growth?
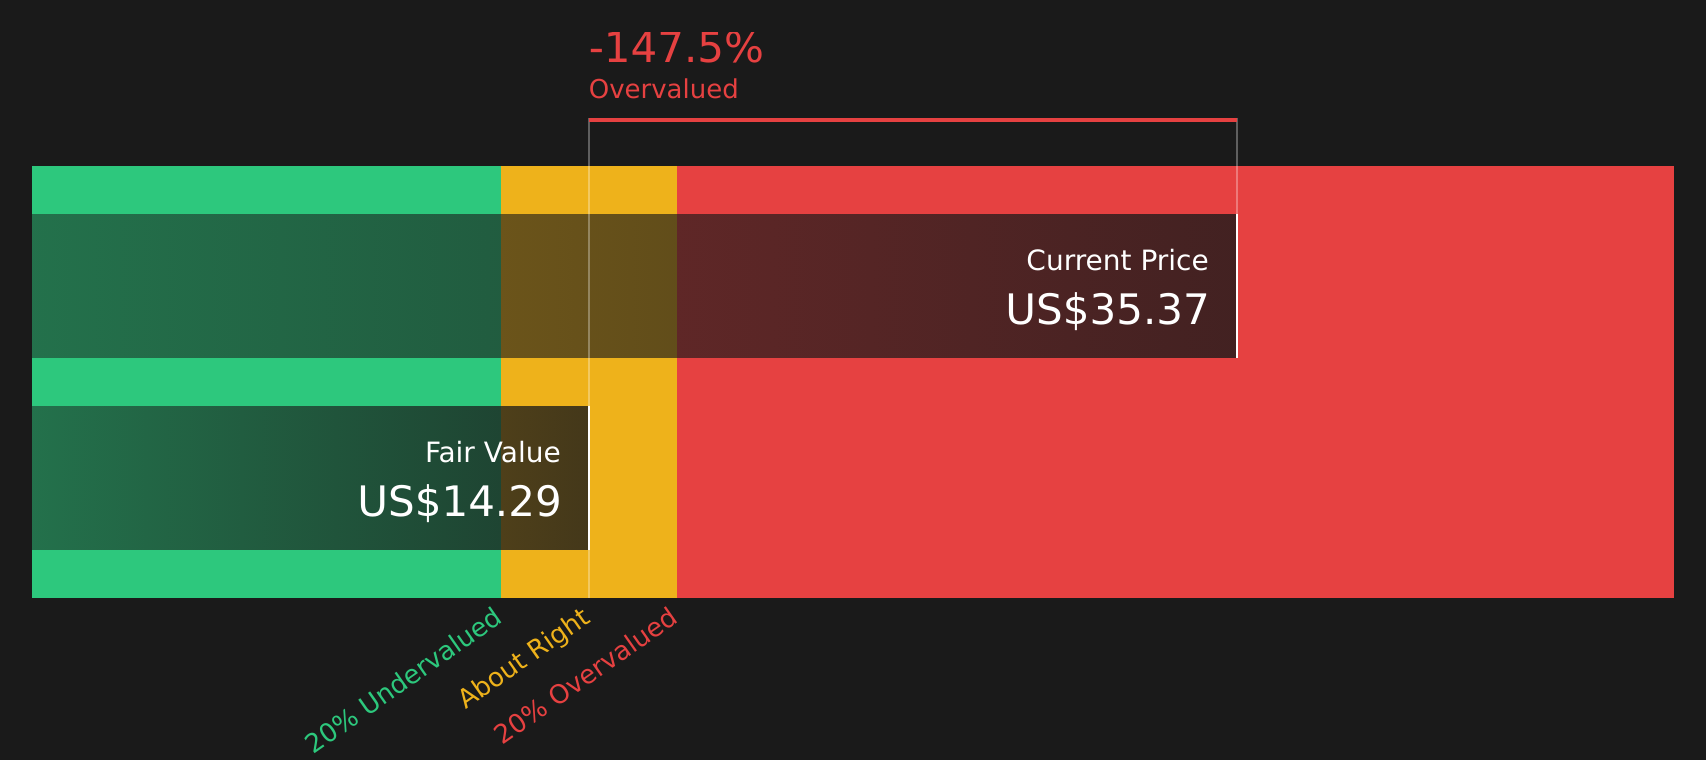
Simply Wall St performs a discounted cash flow (DCF) on every stock in the world every day (check out UGI for example). We show the entire calculation in full. You can track the result in your watchlist or portfolio and be alerted when this changes, or use our stock screener to discover 51 high quality undervalued stocks. If you save a screener we even alert you when new companies match - so you never miss a potential opportunity.
Next Steps
If the split views on UGI have you torn, this is a good moment to move fast and check the underlying data yourself. To see what stands out on both sides of the ledger, take a close look at the 4 key rewards and 2 important warning signs.
Looking for more investment ideas beyond UGI?
If UGI has your attention, do not stop here. Use the Simply Wall Street Screener to uncover fresh stock ideas that might fit your portfolio next.
- Target higher income potential by reviewing companies that qualify as 11 dividend fortresses and see which payouts look more resilient.
- Hunt for quality at a discount through the 51 high quality undervalued stocks and compare how other stocks stack up against UGI on fundamentals.
- Prioritise capital protection by checking companies in the 88 resilient stocks with low risk scores and see which businesses maintain steadier risk profiles.
This article by Simply Wall St is general in nature. We provide commentary based on historical data and analyst forecasts only using an unbiased methodology and our articles are not intended to be financial advice. It does not constitute a recommendation to buy or sell any stock, and does not take account of your objectives, or your financial situation. We aim to bring you long-term focused analysis driven by fundamental data. Note that our analysis may not factor in the latest price-sensitive company announcements or qualitative material. Simply Wall St has no position in any stocks mentioned.