

Union Pacific (UNP) Stock Looks Reasonable On Cash Flow While Earnings Suggest More
Union Pacific Corporation UNP | 0.00 |
Union Pacific stock has delivered a 46.3% total return over the past 5 years, and at around US$293.73 the question now is whether that strength still lines up with what the valuation work is saying. The Discounted Cash Flow (DCF) intrinsic value estimate points to a roughly fair price, while the earnings multiple view screens the stock as undervalued.
- Over 5 years, a 46.3% return suggests Union Pacific has already rewarded patient shareholders, so any new position may rely more heavily on what happens to future earnings and cash flows.
- For long term value, steady cash generation from the core rail network can support the current pricing, while any sustained pressure on volumes or operating costs may weigh on what investors are willing to pay.
- On Simply Wall St’s broader checks, Union Pacific is assessed as undervalued in 4 of 6 areas, which is a mixed picture rather than a clear bargain, and you can see the breakdown in the valuation score of 4 out of 6.
The issue now is whether Union Pacific’s current share price still leaves enough valuation support after that multi year run, given the split between a fairly valued intrinsic estimate and cheaper looking multiples.
Where Does Union Pacific Sit on Cash Flow?
The Discounted Cash Flow (DCF) model values a company based on the cash it is expected to generate for shareholders. For Union Pacific, the model uses latest twelve month free cash flow of about $6.5b and assumes that free cash flow continues to grow from this base rather than relying on a one off spike.
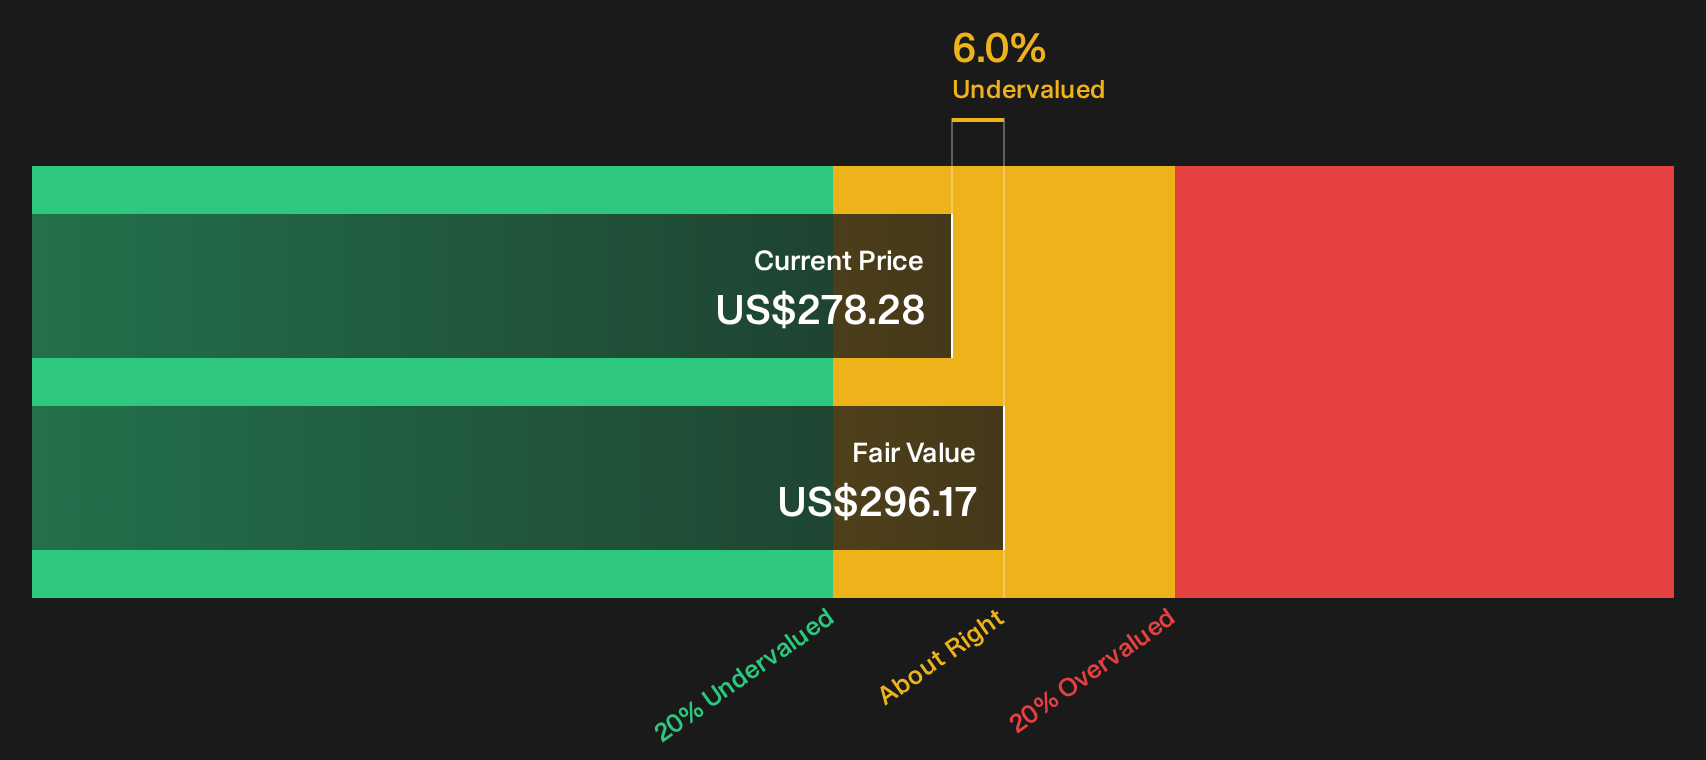
Based on these cash flow projections, the 2 Stage Free Cash Flow to Equity model arrives at an intrinsic value of about $295 per share. That is close to the current share price of around $293.73, which points to only a 0.4% discount.
On this DCF view, Union Pacific stock currently appears to be fairly valued.
Union Pacific is fairly valued according to our Discounted Cash Flow (DCF), but this can change at a moment's notice. Track the value in your watchlist or portfolio and be alerted on when to act.
Does Union Pacific Look Undervalued on Earnings?
The P/E ratio fits Union Pacific well because earnings are a key focus for a mature, profitable rail operator. Union Pacific currently trades on a P/E of about 23.8x, compared with a transportation industry average of around 31.8x and a peer group average near 28.5x. That puts the stock at a lower earnings multiple than many comparable companies.
Simply Wall St’s model suggests a fair P/E for Union Pacific of roughly 28.0x when factoring in its size, margins and risk profile. Against that yardstick, the current 23.8x implies the stock trades below the level that model would typically expect investors to pay for its earnings.
On this P/E view, Union Pacific stock appears inexpensive relative to both its tailored fair multiple and broader industry benchmarks.

The Union Pacific Narrative: What Would Justify Today's Price?
Simply Wall St Narratives pick up where this Union Pacific valuation puzzle leaves off. They spell out which assumptions about Union Pacific's future growth, margins and earnings would need to hold for the stock to be worth materially more or materially less than today's price, and sit on the company's Community page. Rather than relying on a single multiple or model output, each one lays out its underlying assumptions so you can compare them with actual results over time.
You can add your voice to the Union Pacific story by publishing a Narrative that sets out your number driven view on where its growth, margins and execution go from here. Share your thesis, track how it stacks up against future results, and help other investors see Union Pacific's valuation through a clear, data based lens.
Do you think there's more to the story for Union Pacific? Head over to our Community to see what others are saying!
The Bottom Line
Union Pacific’s Discounted Cash Flow (DCF) intrinsic value estimate sits very close to the current share price, so the cash flow view points to a stock that is roughly in line with its fundamentals rather than obviously cheap. The earnings multiple view is more generous and screens the stock as undervalued relative to peers. Together with the mixed broader checks, that suggests any edge now comes from whether earnings and cash flows can support a firmer multiple over time instead of from a clear discount today. The key debate is whether Union Pacific can sustain the profitability that justifies both its current price and a higher P/E.
This article by Simply Wall St is general in nature. We provide commentary based on historical data and analyst forecasts only using an unbiased methodology and our articles are not intended to be financial advice. It does not constitute a recommendation to buy or sell any stock, and does not take account of your objectives, or your financial situation. We aim to bring you long-term focused analysis driven by fundamental data. Note that our analysis may not factor in the latest price-sensitive company announcements or qualitative material. Simply Wall St has no position in any stocks mentioned.