

Virtus Investment Partners (VRTS) Could Be 30% Below Fair Value On Its Rebound
Virtus Investment Partners, Inc. VRTS | 0.00 |
With no recent headline event driving interest in Virtus Investment Partners (VRTS), investors are instead focusing on its current trading profile, recent share performance and core fundamentals in the asset management business.
The recent 1 month share price return of 12.25% and 90 day share price return of 14.19% suggest improving momentum for Virtus Investment Partners, even though the 1 year total shareholder return declined 9.57% and the 5 year total shareholder return declined 27.86%.
If Virtus Investment Partners has you reassessing your portfolio, this can be a good time to widen your search with 18 top founder-led companies
After a sharp 30 day rebound but weaker multi year returns, Virtus Investment Partners now sits at a crossroads. Does the current valuation still offer enough upside potential to justify the risks you are taking?
Price to Earnings of 9.5x: Is it justified?
On a P/E of 9.5x, Virtus Investment Partners trades at a level that screens as inexpensive relative to both its direct peers and the broader US Capital Markets industry, even after the recent rebound in the share price to $165.66.
The P/E ratio compares the current share price with earnings per share. It is a quick way to see how much investors are paying for each dollar of profit. For an asset manager like Virtus Investment Partners, where fee based earnings and market linked revenues are central to the story, this measure often gets a lot of attention from investors assessing what they are paying for those profits.
Here, the contrast is clear. Management’s stock trades on a P/E of 9.5x, while the US Capital Markets industry average is 39.3x and the stated peer group average is 14.8x. That wide gap suggests the market is pricing Virtus Investment Partners’ earnings at a substantial discount to competitors, even though the company reports high quality earnings and a current net profit margin of 14% on revenue of $834.47m.
Result: Price-to-Earnings of 9.5x (UNDERVALUED)
However, there are still clear risks for Virtus Investment Partners, including revenue that declined 4.26% over the past year and multi year total returns that remain weak.
Another View on Virtus Investment Partners' Value
The P/E comparison presents Virtus Investment Partners as inexpensive, and our DCF model points in the same direction. At a share price of $165.66, the stock trades around 30% below an estimated future cash flow value of $236.57. This raises the question of how comfortable you are relying on cash flow assumptions instead of earnings multiples.
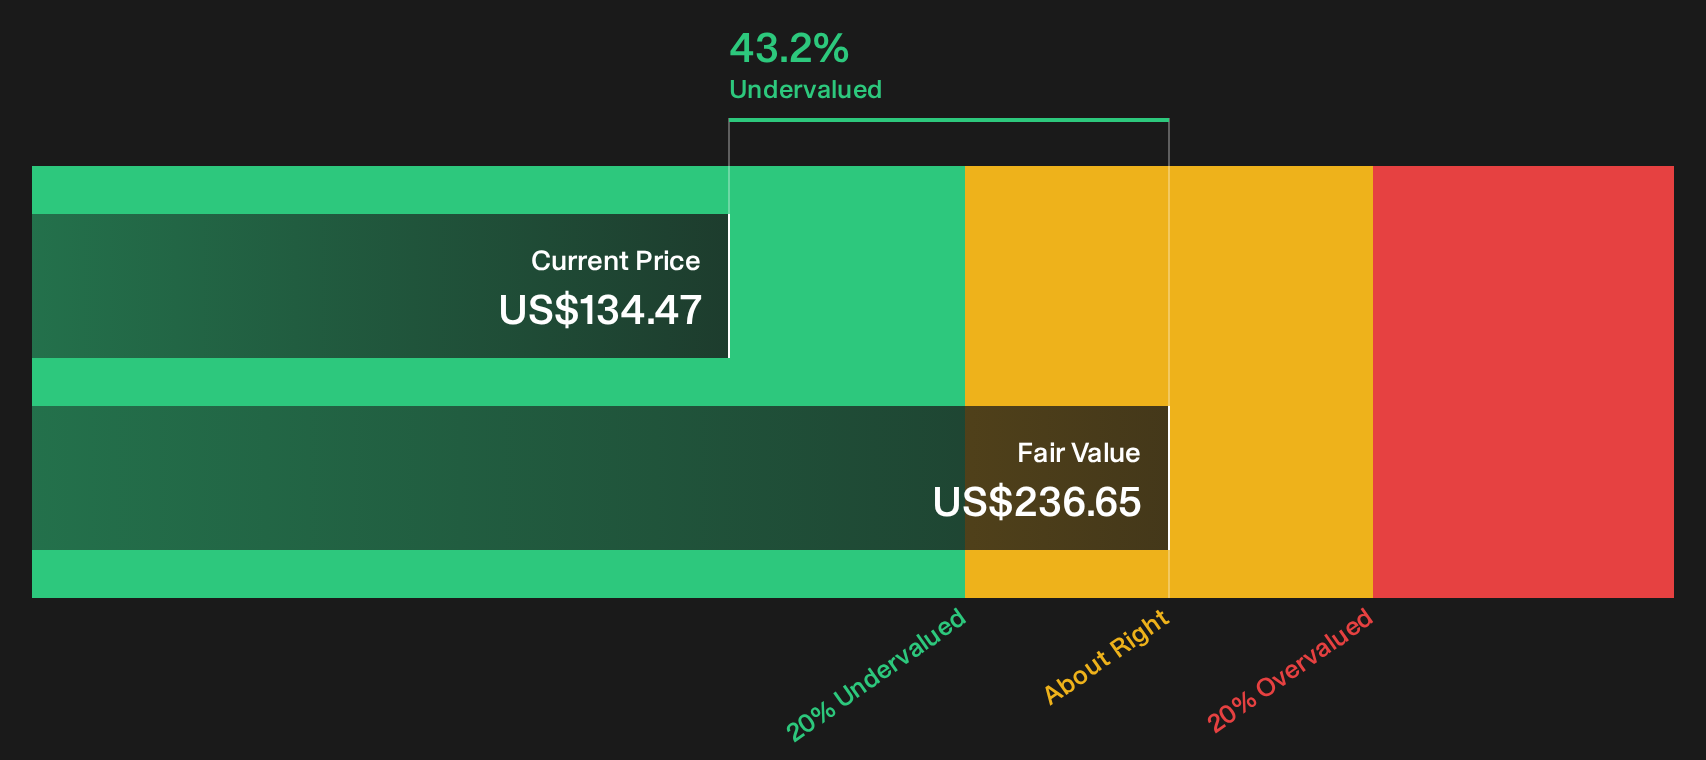
Simply Wall St performs a discounted cash flow (DCF) on every stock in the world every day (check out Virtus Investment Partners for example). We show the entire calculation in full. You can track the result in your watchlist or portfolio and be alerted when this changes, or use our stock screener to discover 50 high quality undervalued stocks. If you save a screener we even alert you when new companies match - so you never miss a potential opportunity.
Next Steps
If this mix of cautious and optimistic signals around Virtus Investment Partners leaves you undecided, take a closer look at the data now. You can then shape your own view with the 1 key reward and 3 important warning signs
Looking for more ideas beyond Virtus Investment Partners?
If Virtus Investment Partners has sharpened your focus on valuation and quality, do not stop here, you could miss other stocks that better suit your goals.
- Scan for potential long term compounders by filtering companies that trade below their assessed value with the 50 high quality undervalued stocks.
- Strengthen your income stream by reviewing companies built around consistent payouts using the 9 dividend fortresses.
- Prioritise resilience by focusing on companies with robust finances through the 84 resilient stocks with low risk scores.
This article by Simply Wall St is general in nature. We provide commentary based on historical data and analyst forecasts only using an unbiased methodology and our articles are not intended to be financial advice. It does not constitute a recommendation to buy or sell any stock, and does not take account of your objectives, or your financial situation. We aim to bring you long-term focused analysis driven by fundamental data. Note that our analysis may not factor in the latest price-sensitive company announcements or qualitative material. Simply Wall St has no position in any stocks mentioned.