Vornado Realty Trust (VNO) Stock After Mixed Returns And Office Market Uncertainty
Vornado Realty Trust VNO | 0.00 |
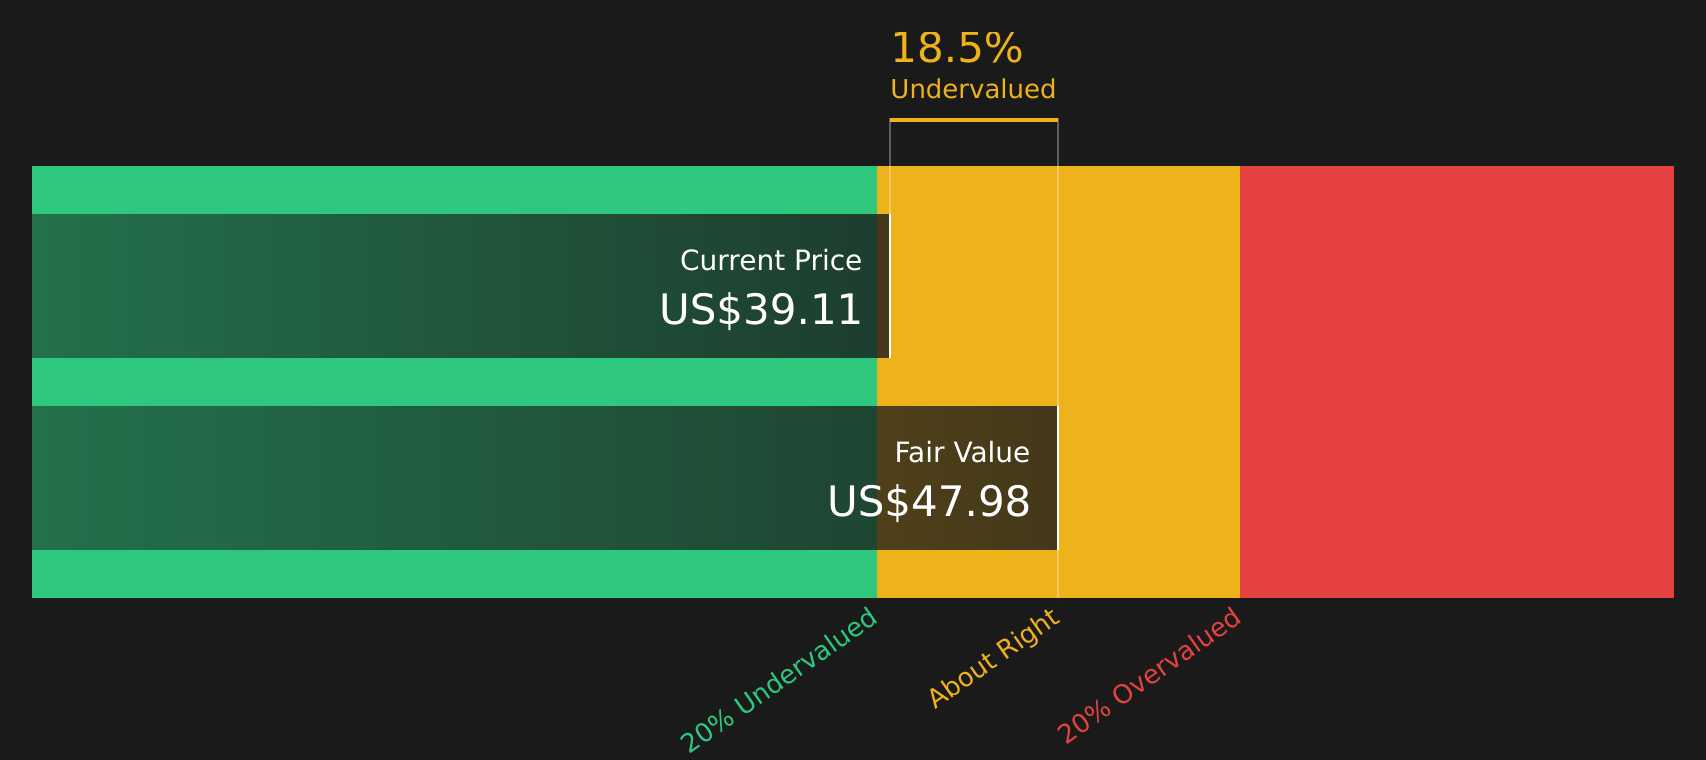
- If you are trying to work out whether Vornado Realty Trust at around US$38 per share looks expensive or appealing, the key question is how its current price stacks up against a fair value estimate.
- The stock has recent returns of 0.7% over 7 days, 16.5% over 30 days, 13.8% year to date, 4.8% over 1 year, a very large gain over 3 years and a 5.0% decline over 5 years, which gives a mixed picture of momentum and risk.
- Recent news around office real estate, including ongoing debate about long term demand for office space and investor focus on high quality urban portfolios, provides useful context for these price moves. For Vornado Realty Trust, attention has centered on how its New York centric portfolio, financing profile and asset quality compare with other office focused real estate investment trusts.
- On Simply Wall St's valuation checks, Vornado Realty Trust has a value score of 4 out of 6. This suggests some areas look attractive while others call for closer inspection. The next sections will break this down across different valuation methods before finishing with a broader way to think about value beyond the numbers alone.
Approach 1: Vornado Realty Trust Discounted Cash Flow (DCF) Analysis
The DCF model for Vornado Realty Trust projects its adjusted funds from operations into the future and then discounts those cash flows back to today, aiming to estimate what the stock could be worth based on its expected cash generation.
In this approach, Vornado Realty Trust is modeled using a 2 stage Free Cash Flow to Equity framework based on adjusted funds from operations. The latest twelve month free cash flow is $485.4 million, and analysts have supplied detailed projections out to 2030. For example, the model uses forecast free cash flow of $260.2 million in 2026 and $497.0 million in 2030, with further years after analyst coverage extrapolated by Simply Wall St.
When all of those projected cash flows are discounted back to today, the DCF model produces an estimated intrinsic value of $48.13 per share for NYSE:VNO. Compared with a current share price around $38, that suggests the stock is about 20.9% undervalued on this specific cash flow view.
Result: UNDERVALUED
Our Discounted Cash Flow (DCF) analysis suggests Vornado Realty Trust is undervalued by 20.9%. Track this in your watchlist or portfolio, or discover 43 more high quality undervalued stocks.
Approach 2: Vornado Realty Trust Price vs Earnings (P/E)
For profitable companies like Vornado Realty Trust, the P/E ratio is a useful way to see how much you are paying for each dollar of earnings, which helps you compare the stock with both its sector and the wider market using a familiar yardstick.
What counts as a normal or fair P/E ratio usually reflects the balance between expected growth and risk, with higher growth or lower perceived risk often lining up with higher multiples, and slower growth or higher risk tending to be associated with lower ones.
Vornado Realty Trust currently trades on a P/E of 9.77x, compared with the Office REITs industry average of 14.77x and a peer group average of 28.49x. Simply Wall St also calculates a proprietary Fair Ratio for Vornado Realty Trust of 7.82x, which reflects company specific factors such as earnings growth, its industry, profit margins, market cap and key risks.
This Fair Ratio is more tailored than a simple comparison with peers or the industry average, because it tries to adjust for the characteristics of Vornado Realty Trust rather than assuming that one size fits all.
Since the actual P/E of 9.77x is above the Fair Ratio of 7.82x, the stock screens as overvalued on this metric.
Result: OVERVALUED

P/E ratios tell one story, but what if the real opportunity lies elsewhere? Start investing in legacies, not executives. Discover our 20 top founder-led companies.
Upgrade Your Decision Making: Choose your Vornado Realty Trust Narrative
Earlier it was mentioned that there is an even better way to think about Vornado Realty Trust than static ratios. This is where Narratives come in as a simple story behind your numbers, linking your view of the company to a forecast for revenue, earnings and margins, then to a fair value that you can compare with the current share price to decide whether the stock looks appealing or expensive to you at that moment.
On Simply Wall St's Community page, Narratives allow you to set assumptions and see a fair value that updates automatically as fresh information such as news or earnings is added. This helps your story and numbers stay aligned rather than frozen in time.
For Vornado Realty Trust, one investor might build a cautious Narrative around heavy Manhattan exposure and leverage and arrive at a fair value close to US$25. Another might focus on Penn District redevelopment and leasing momentum and arrive at a fair value near US$43.64. Your task as an investor is to decide which story, and which set of assumptions, feels more realistic for you.
For Vornado Realty Trust however we will make it really easy for you with previews of two leading Vornado Realty Trust Narratives:
First is a bullish view built around Penn District and New York office leasing. The second is a more cautious take that leans into refinancing, office demand and multiple risk. Use them as opposing anchors while you decide where your own view sits in between.
Fair value in this bullish narrative is set at US$43.64 per share.
At the last close of US$38.08, that implies Vornado Realty Trust trades about 12.7% below this fair value estimate.
The narrative uses a revenue growth rate assumption of 6.04% a year.
- Expects Penn District redevelopment and selective leasing to higher quality tenants to support higher average rents and more resilient earnings.
- Assumes constrained Manhattan office supply and ESG focused upgrades help support pricing power and asset values over time.
- Relies on analysts at the optimistic end of the range, who see a fair value of US$43.64 despite modeling much lower future earnings and a very large future P/E multiple.
Fair value in this more cautious narrative is set at US$25.00 per share.
At the last close of US$38.08, that implies Vornado Realty Trust trades about 52.6% above this fair value estimate.
The narrative uses a revenue growth rate assumption of 1.95% a year.
- Focuses on ongoing pressure from hybrid work, high Manhattan exposure and elevated vacancy across U.S. offices that could weigh on occupancy and rents.
- Highlights refinancing needs, leverage and ESG related capital spending as potential drags on free cash flow and room for shareholder returns.
- Aligns with bearish analysts who anchor on a US$25.00 fair value and assume modest revenue growth, much lower margins and a very large future P/E multiple applied to reduced earnings.
These opposing Vornado Realty Trust Narratives give you a clear valuation range and set of assumptions to test against your own expectations for New York office demand, refinancing conditions and the Penn District projects.
Once you have a sense of which story feels closer to your view, you can go further with the full community Narratives and supporting data for Vornado Realty Trust, including the underlying earnings, cash flow and valuation work that sit behind each fair value estimate.
To see how these results tie into long-term growth, risks, and valuation, check out the full range of community narratives for Vornado Realty Trust on Simply Wall St. Add the company to your watchlist or portfolio so you'll be alerted when the story evolves.
Do you think there's more to the story for Vornado Realty Trust? Head over to our Community to see what others are saying!

This article by Simply Wall St is general in nature. We provide commentary based on historical data and analyst forecasts only using an unbiased methodology and our articles are not intended to be financial advice. It does not constitute a recommendation to buy or sell any stock, and does not take account of your objectives, or your financial situation. We aim to bring you long-term focused analysis driven by fundamental data. Note that our analysis may not factor in the latest price-sensitive company announcements or qualitative material. Simply Wall St has no position in any stocks mentioned.