

W. R. Berkley (WRB) Stock Looks Pricey Even With A 45% Value Gap
W. R. Berkley Corporation WRB | 0.00 |
W. R. Berkley stock has delivered a strong 133.5% total return over the past five years, yet the current valuation signals are mixed, with an intrinsic value estimate from the Excess Returns model pointing to a large discount while market multiples suggest the shares are not cheap.
- Over five years, W. R. Berkley has returned 133.5%, which puts recent short term share price softness into the context of a strong longer term run.
- The creation of Berkley Meridian can support expectations for future specialty insurance earnings. However, execution risk around integrating Verus Specialty Insurance and Vela Insurance Services may affect how much value investors are willing to ascribe to the new platform.
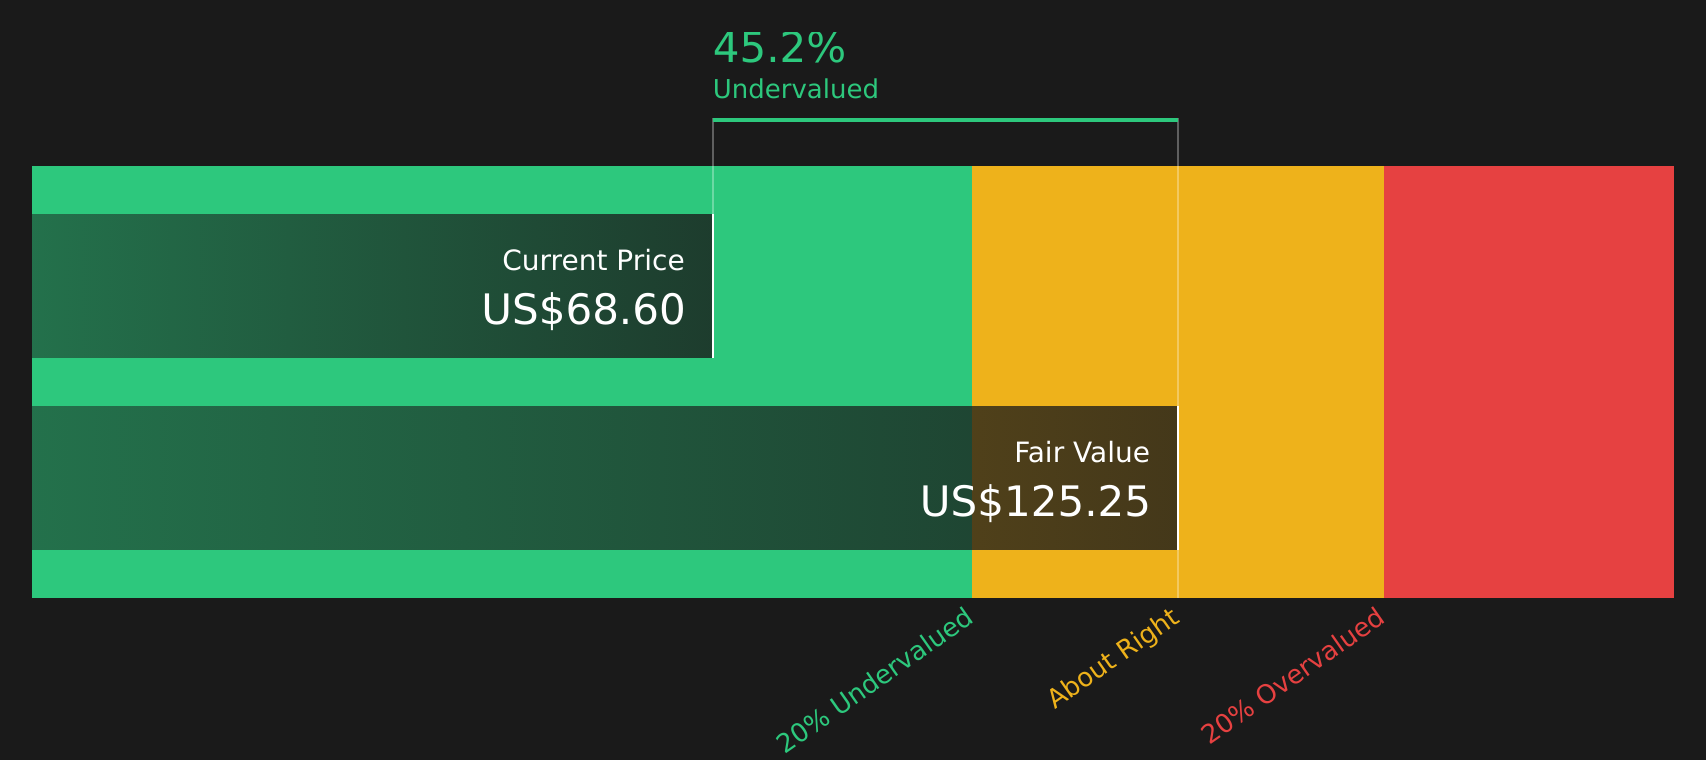
- W. R. Berkley scores 2 out of 6 on a broad set of valuation checks, which leans more toward expensive than clear bargain status, even though the Excess Returns model suggests the stock trades at a sizeable discount to intrinsic value, as shown in the valuation summary.
The issue now is whether W. R. Berkley’s current share price already reflects its specialty insurance prospects or if the intrinsic value estimate still indicates a meaningful margin of safety.
Is W. R. Berkley a Bargain on Excess Returns?
The Excess Returns model estimates W. R. Berkley’s intrinsic value by comparing what it earns on equity to the return that investors require. For W. R. Berkley, the model uses a Book Value of $25.31 per share and a Stable EPS of $5.55 per share, with those earnings based on weighted future Return on Equity estimates from 10 analysts. With an Average Return on Equity of 18.29% and a Cost of Equity of $2.20 per share, the implied Excess Return is $3.36 per share, which is then capitalised over time on a Stable Book Value base of $30.36 per share.
This framework produces an intrinsic value estimate of $125.25 per share, which is 44.8% above the current market price used in the model. The recent creation of Berkley Meridian, which combines Verus Specialty Insurance and Vela Insurance Services, is one factor behind the assumption that the company can continue earning returns on equity above its cost of capital.
On these Excess Returns assumptions, W. R. Berkley stock currently screens as undervalued relative to its estimated intrinsic value.
Our Excess Returns analysis suggests W. R. Berkley is undervalued by 44.8%. Track this in your watchlist or portfolio, or discover 50 more high quality undervalued stocks.
Does W. R. Berkley Look Pricey on Earnings?
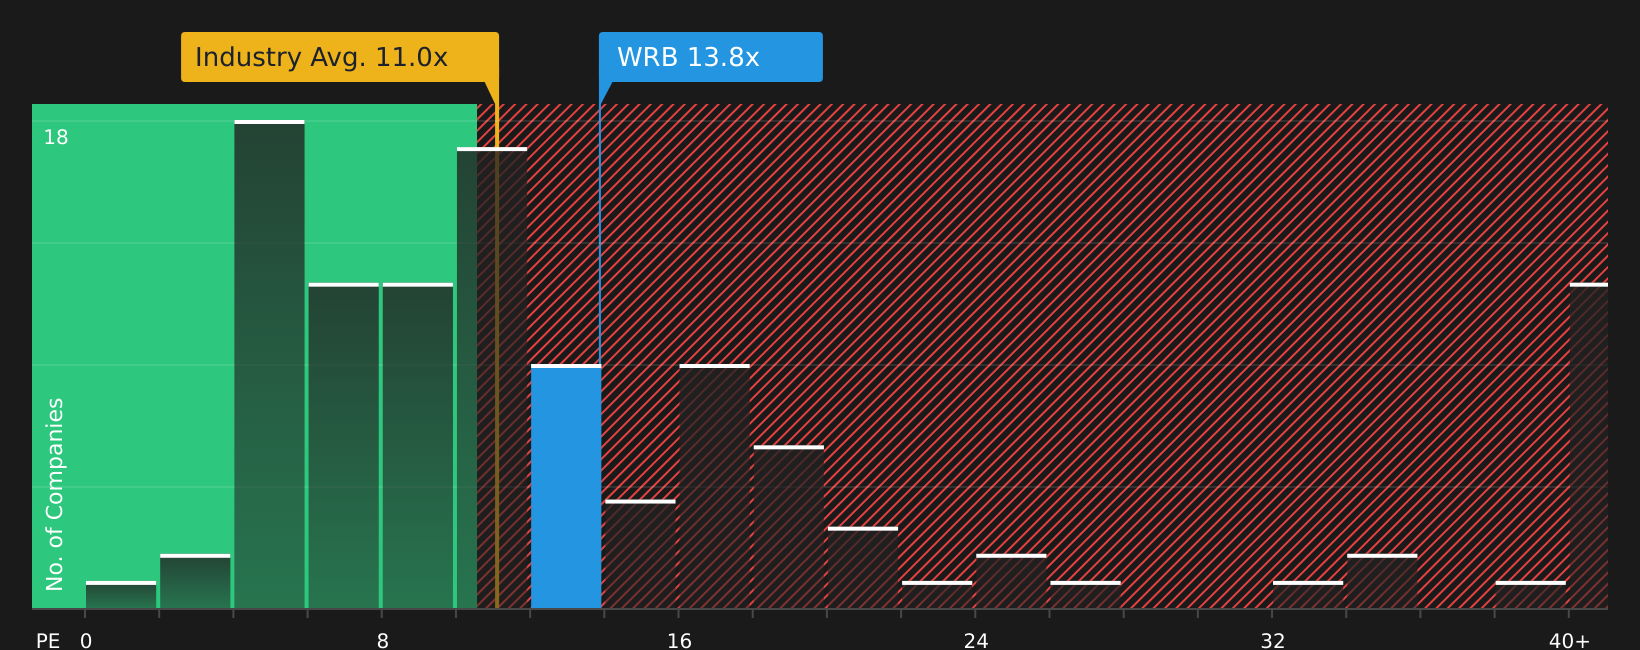
The P/E ratio is a useful way to judge what you are paying for each dollar of W. R. Berkley earnings. On this measure, the stock trades on about 13.9x earnings, which is above both the Insurance industry average P/E of 11.0x and the peer group average of 10.0x.
The tailored fair P/E ratio for W. R. Berkley is estimated at 11.5x, which is lower than the current 13.9x. This indicates that investors are currently paying a premium to what the model implies is reasonable given the company’s earnings profile, industry, size and risk. The gap is not extreme but it does point to W. R. Berkley stock appearing richer than both its sector and its own fair multiple estimate.
On the P/E multiple, W. R. Berkley shares appear overvalued relative to both the industry and the model’s fair ratio.
The W. R. Berkley Narrative: What Would Justify Today's Price?
Simply Wall St Narratives for W. R. Berkley pick up where the valuation puzzle leaves off by setting out the future growth, margins and earnings paths that would need to play out for W. R. Berkley's stock to be worth significantly more or less than today’s price. Where a ratio or model gives a single figure, these narratives outline the business conditions that number relies on, so you can watch how those assumptions develop over time on the Community page.
Community views on W. R. Berkley are far apart, with one side focusing on margin resilience and the other on softer pricing and risk.
Bull case: 17% undervalued
"Recent investments in operation incubation, coupled with a record-high and increasingly high-yielding investment portfolio are set to fuel multi-year earnings power and book value expansion..."
Bear case: 29% overvalued
"Increased severity and frequency of climate-related catastrophes is likely to drive higher claims payouts and undermine underwriting profitability for W. R. Berkley over the long term..."
Do you think there's more to the story for W. R. Berkley? Head over to our Community to see what others are saying!
The Bottom Line
For W. R. Berkley, the intrinsic value estimate points to the stock screening as undervalued, while the P/E work suggests it is overvalued relative to peers and its own fair multiple. That split reflects different lenses. The Excess Returns approach leans on sustained returns on equity and capital deployment, whereas the market multiple view reflects what investors are currently willing to pay for the company’s growth profile and risk. Broader checks still lean weak, so the key question is whether W. R. Berkley can execute on Berkley Meridian and its specialty ambitions well enough for the market to keep paying a premium.
This article by Simply Wall St is general in nature. We provide commentary based on historical data and analyst forecasts only using an unbiased methodology and our articles are not intended to be financial advice. It does not constitute a recommendation to buy or sell any stock, and does not take account of your objectives, or your financial situation. We aim to bring you long-term focused analysis driven by fundamental data. Note that our analysis may not factor in the latest price-sensitive company announcements or qualitative material. Simply Wall St has no position in any stocks mentioned.