

W. R. Berkley (WRB), What Is Behind The Fresh Attention Today?
W. R. Berkley Corporation WRB | 0.00 |
Why Berkley Meridian matters for W. R. Berkley stock
W. R. Berkley (WRB) is reshaping its specialty insurance operations with the creation of Berkley Meridian, combining Verus Specialty Insurance and Vela Insurance Services under one shared structure and vision.
The new unit focuses on construction, professional liability, garage, casualty and other specialty lines in the E&S wholesale broker market, while integration work continues into early 2027.
At a US$69.70 share price, W. R. Berkley has seen a 90 day share price return of 3.52%, while the 5 year total shareholder return of 135.06% reflects a much stronger long run outcome than the recent 30 day share price decline of 7.63% might suggest, as investors weigh the Berkley Meridian announcement alongside broader sentiment.
If this type of corporate reshaping has you thinking more broadly about where growth and resilience could come from next, this may be an appropriate time to broaden your search and check out 20 top founder-led companies
Bulls see Berkley Meridian as a smart way for W. R. Berkley to sharpen its specialty edge, while recent share price weakness fuels the bear side. Which case fits the current valuation best is what comes next.
Most Popular Narrative: 2% Overvalued
The most followed narrative puts W. R. Berkley’s fair value at $68.33, slightly below the recent $69.70 close. This sets up a tight valuation debate.
The analysts have a consensus price target of $72.733 for W. R. Berkley based on their expectations of its future earnings growth, profit margins and other risk factors. However, there is a degree of disagreement amongst analysts, with the most bullish reporting a price target of $86.0, and the most bearish reporting a price target of just $56.0.
Want to see what is driving that narrow gap between price and fair value? The core of this narrative is how margins, earnings and future valuation multiples fit together.
Result: Fair Value of $68.33 (OVERVALUED)
However, W. R. Berkley investors still need to watch for softening commercial and reinsurance pricing and rising loss costs that could pressure margins and challenge this fair value story.
Another View On W. R. Berkley’s Value
The DCF model used in the Simply Wall St report points to a very different conclusion for W. R. Berkley. At a share price of $69.70, the stock is shown as trading about 44.4% below an estimated future cash flow value of $125.25, which presents it as undervalued rather than 2% overvalued.
The key question for investors is which set of assumptions appears more realistic: the tighter multiple-based view or the more optimistic cash flow outlook.
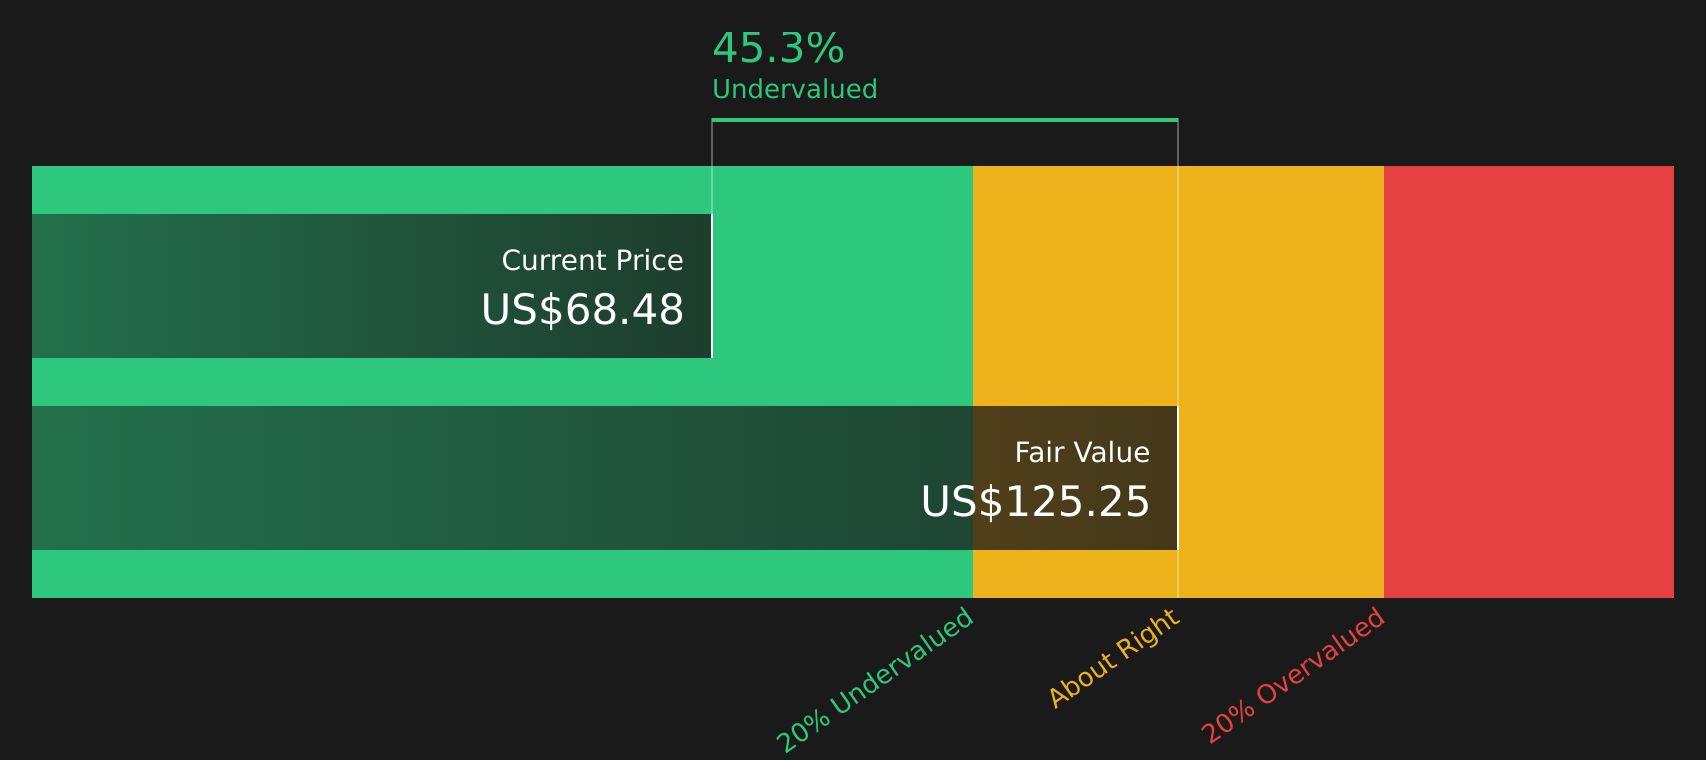
Simply Wall St performs a discounted cash flow (DCF) on every stock in the world every day (check out W. R. Berkley for example). We show the entire calculation in full. You can track the result in your watchlist or portfolio and be alerted when this changes, or use our stock screener to discover 49 high quality undervalued stocks. If you save a screener we even alert you when new companies match - so you never miss a potential opportunity.
Next Steps
If the mixed signals around W. R. Berkley have you on the fence, this is a good moment to move quickly, review the numbers and form your own judgment using the 2 key rewards and 2 important warning signs
Looking for more investment ideas beyond W. R. Berkley?
If you like the detail around W. R. Berkley but want broader context, use the Simply Wall St screener to spot other opportunities before they move.
- Pinpoint potential value opportunities early by scanning 49 high quality undervalued stocks that combine quality fundamentals with prices that may lag underlying business strength.
- Prioritize reliability and sleep a little easier at night by focusing on 74 resilient stocks with low risk scores that score well on stability and financial risk checks.
- Seek future standouts before they hit the headlines by sorting through a screener containing 18 high quality undiscovered gems.
This article by Simply Wall St is general in nature. We provide commentary based on historical data and analyst forecasts only using an unbiased methodology and our articles are not intended to be financial advice. It does not constitute a recommendation to buy or sell any stock, and does not take account of your objectives, or your financial situation. We aim to bring you long-term focused analysis driven by fundamental data. Note that our analysis may not factor in the latest price-sensitive company announcements or qualitative material. Simply Wall St has no position in any stocks mentioned.