

What Hubbell (HUBB) Guidance Upgrade Means For Its Valuation
Hubbell Incorporated HUBB | 0.00 |
Hubbell (HUBB) is back in focus after raising its full year 2026 guidance, supported by recent double digit sales growth, stronger adjusted earnings and ongoing data center and utility investment trends.
Despite the guidance upgrade and steady dividend news in late July 2026, Hubbell’s share price has eased in recent weeks. The 30-day share price return is down 3.58% and the 90-day share price return is down 7.06%, while the 1-year total shareholder return of 12.07% and 5-year total shareholder return of 155.18% point to momentum that has built over a longer period.
If Hubbell’s grid and data center exposure has your attention, it can be useful to widen the lens to other power infrastructure ideas through the Simply Wall St screener for 35 power grid technology and infrastructure stocks
Hubbell has raised its 2026 guidance and is seeing strong interest around grid and data center exposure, yet the share price has eased in the short term. Is this pullback about fundamentals or just sentiment, and how does the current valuation reflect that?
Most Popular Narrative: 14.2% Undervalued
The most followed narrative puts Hubbell’s fair value at $550.77 versus the last close of $472.55, which frames the recent share price pullback in a different light.
The Utility Solutions segment is experiencing organic growth resurgence, particularly in grid infrastructure, supported by strong transmission and substation markets due to increasing grid modernization and electrification. This growth trend should drive higher future revenues.
Want to see what sits behind that confidence in Hubbell’s grid exposure? The narrative leans on steady revenue compounding, firmer margins and a richer future earnings multiple.
Result: Fair Value of $550.77 (UNDERVALUED)
However, Hubbell’s story can change quickly if tariff and raw material cost pressures squeeze margins, or if order growth in grid automation slows further.
Another View on Hubbell’s Valuation
The most popular narrative has Hubbell trading around 14.2% below a fair value of $550.77. However, the SWS DCF model points in the opposite direction, with an estimate of future cash flow value at $392.16 compared with the current price of $472.55, which signals overvaluation instead. Which framework do you think better fits how Hubbell actually generates cash?
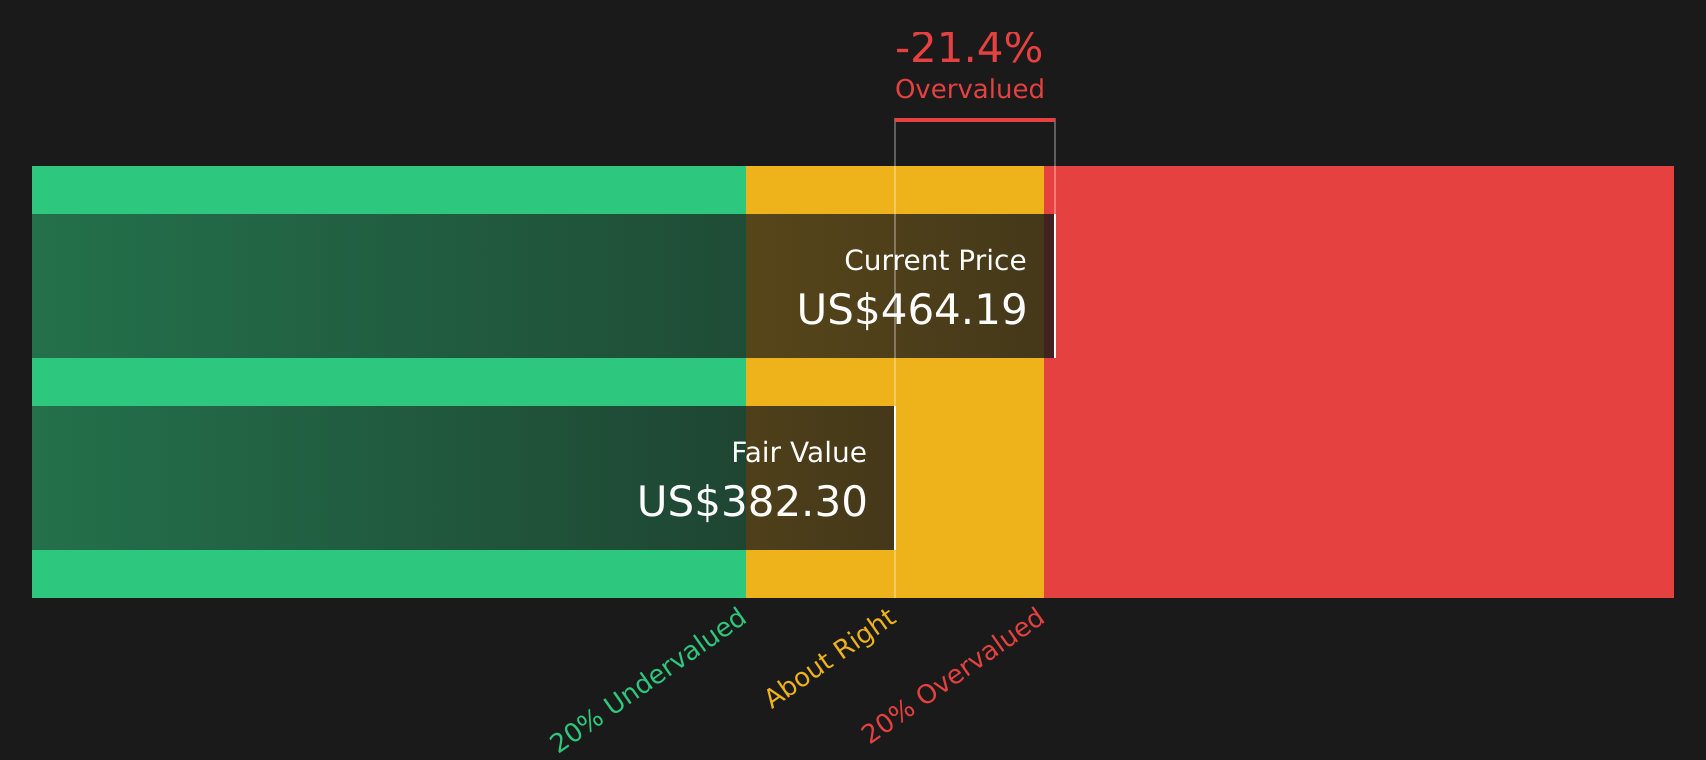
Simply Wall St performs a discounted cash flow (DCF) on every stock in the world every day (check out Hubbell for example). We show the entire calculation in full. You can track the result in your watchlist or portfolio and be alerted when this changes, or use our stock screener to discover 55 high quality undervalued stocks. If you save a screener we even alert you when new companies match - so you never miss a potential opportunity.
Next Steps
If the mixed signals on Hubbell have you on the fence, this is a good moment to review the full picture and decide where you stand. Start by weighing the 4 key rewards and 1 important warning sign.
Looking for more investment ideas beyond Hubbell?
If Hubbell has sharpened your interest in the power grid theme, do not stop there. Use the Simply Wall St screener to round out your watchlist with different types of opportunities.
- Spot potential mispricings by scanning for companies that look attractively valued on both quality and price using the 55 high quality undervalued stocks.
- Strengthen your income stream by searching for stocks that offer higher yields and focus on sustainable payouts with the 9 dividend fortresses.
- Sleep easier by filtering for companies that pair solid finances with lower risk profiles through the 81 resilient stocks with low risk scores.
This article by Simply Wall St is general in nature. We provide commentary based on historical data and analyst forecasts only using an unbiased methodology and our articles are not intended to be financial advice. It does not constitute a recommendation to buy or sell any stock, and does not take account of your objectives, or your financial situation. We aim to bring you long-term focused analysis driven by fundamental data. Note that our analysis may not factor in the latest price-sensitive company announcements or qualitative material. Simply Wall St has no position in any stocks mentioned.