

What Sabine Royalty Trust (SBR)'s Higher Output and Lower July Payout Means For Shareholders
Sabine Royalty Trust SBR | 0.00 |
- Sabine Royalty Trust recently reported past production results for July 2026, with oil output of 54,139 bbls and gas production of 1,074,976 Mcf, alongside a reduced monthly cash distribution of US$0.429150 per unit declared by Argent Trust Company for payment on July 29, 2026.
- This combination of higher reported production volumes but a lower declared distribution highlights how the trust’s payout can diverge from short-term operational trends.
- Next, we will examine how the reduced July cash distribution, despite higher production, shapes Sabine Royalty Trust’s investment narrative.
This technology could replace computers: discover 26 stocks that are working to make quantum computing a reality.
What Is Sabine Royalty Trust's Investment Narrative?
To own Sabine Royalty Trust, you really have to buy into the idea of a pure play, pass-through vehicle where distributions closely mirror underlying commodity prices and timing of receipts rather than production alone. The July 2026 update, with higher reported oil and gas volumes but a lower US$0.429150 per-unit cash distribution, underlines that point and slightly reframes the near-term story: short-term catalysts still hinge on monthly payout moves, but investors may pay closer attention to price realizations, prior-period adjustments and the trust’s already “unstable” dividend track record. Combined with recent revenue and earnings declines and unit price underperformance versus the broader US oil and gas space, this mismatch between volumes and payouts does not look like a one-off quirk so much as a reminder that headline production numbers can be a poor guide to next month’s check.
Yet the way distributions move versus volumes is a risk many investors may be underestimating.
Despite retreating, Sabine Royalty Trust's shares might still be trading 46% above their fair value. Discover the potential downside here.Exploring Other Perspectives
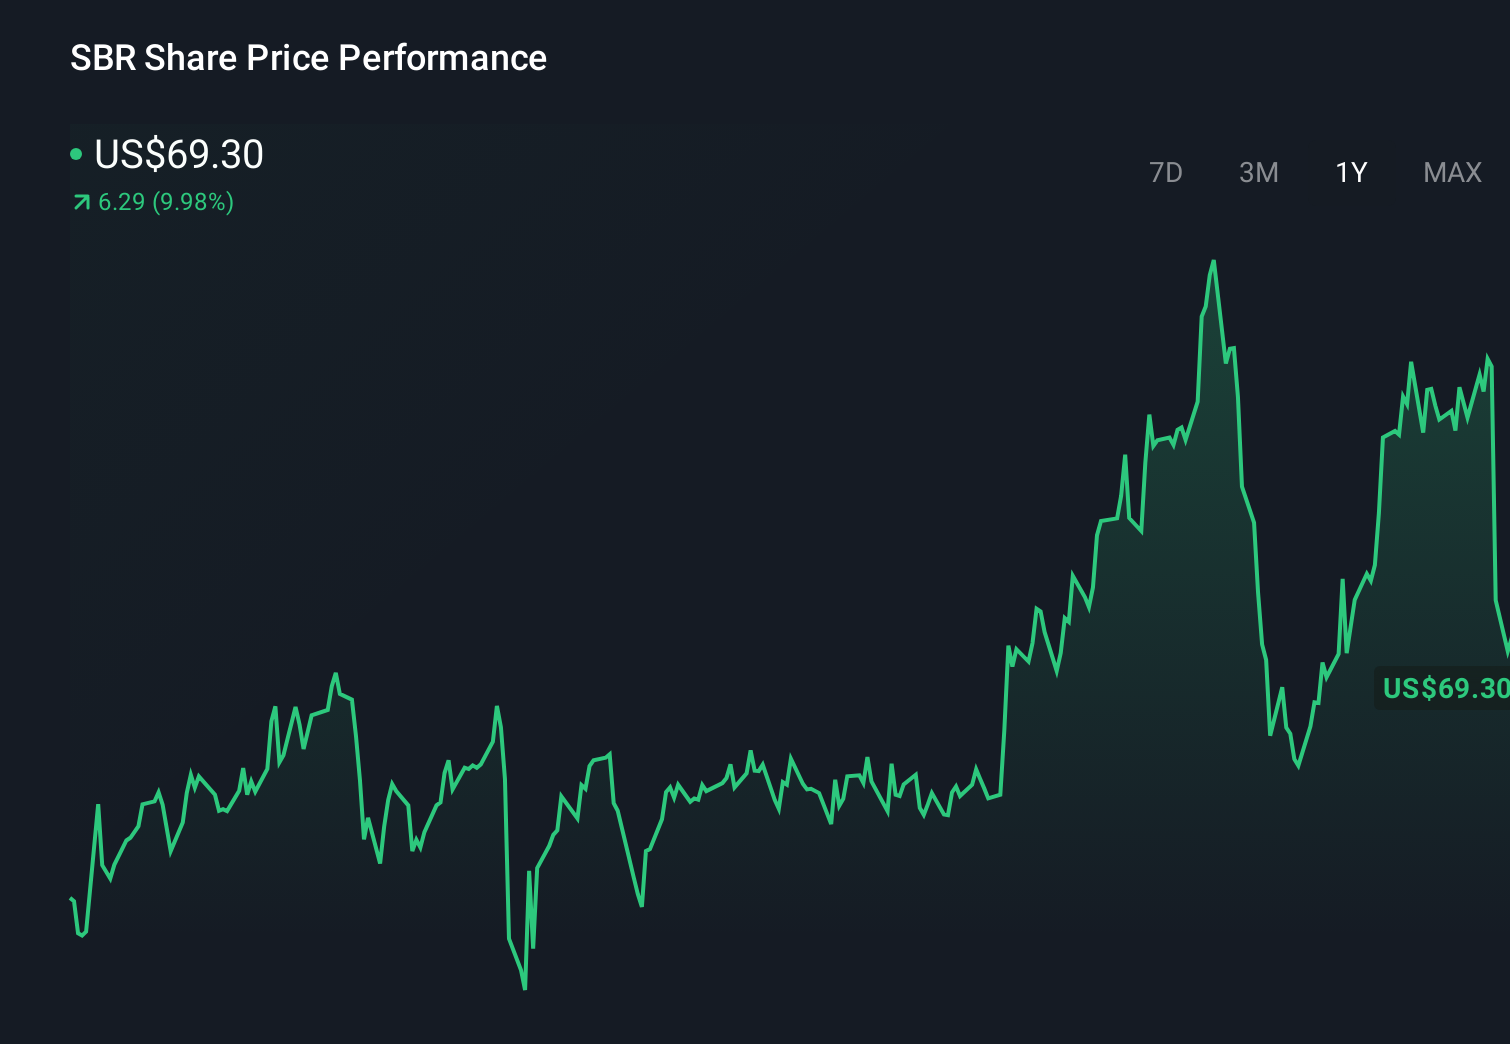
The Simply Wall St Community’s two fair value estimates span roughly US$60.80 to US$136.81 per unit, underscoring how far apart individual views can be. Set that against the recent cut in the July cash distribution despite stronger production, and you start to see why different investors may draw very different conclusions about Sabine’s ability to support future payouts. Reading across these perspectives can help you weigh how much variability in income you are really comfortable with.
Explore 2 other fair value estimates on Sabine Royalty Trust - why the stock might be worth as much as 84% more than the current price!
Decide For Yourself
Disagree with this assessment? Extraordinary investment returns rarely come from following the herd, so go with your instincts.
- A great starting point for your Sabine Royalty Trust research is our analysis highlighting 1 key reward and 1 important warning sign that could impact your investment decision.
- Our free Sabine Royalty Trust research report provides a comprehensive fundamental analysis summarized in a single visual - the Snowflake - making it easy to evaluate Sabine Royalty Trust's overall financial health at a glance.
Searching For A Fresh Perspective?
Our daily scans reveal stocks with breakout potential. Don't miss this chance:
- Find 44 companies with promising cash flow potential yet trading below their fair value.
- Capitalize on the AI infrastructure supercycle with our selection of the 52 best 'picks and shovels' of the AI gold rush converting record-breaking demand into massive cash flow.
- The future of work is here. Discover the 33 top robotics and automation stocks leading the charge in AI-driven automation and industrial transformation.
This article by Simply Wall St is general in nature. We provide commentary based on historical data and analyst forecasts only using an unbiased methodology and our articles are not intended to be financial advice. It does not constitute a recommendation to buy or sell any stock, and does not take account of your objectives, or your financial situation. We aim to bring you long-term focused analysis driven by fundamental data. Note that our analysis may not factor in the latest price-sensitive company announcements or qualitative material. Simply Wall St has no position in any stocks mentioned.