

White Mountains Insurance Group (WTM) Is Back In Focus, What Is Catching Investors' Attention?
White Mountains Insurance Group Ltd WTM | 0.00 |
Why White Mountains Insurance Group Stock Is Back in Focus After Earnings
White Mountains Insurance Group (WTM) has drawn fresh attention after releasing second quarter 2026 earnings, reporting higher revenue and net income versus a year earlier alongside continued progress on its share repurchase program.
For the quarter ended June 30, 2026, the company reported revenue of US$844.6 million compared with US$689.2 million in the same period last year. Net income was US$199.5 million versus US$122.9 million a year ago.
Basic and diluted earnings per share from continuing operations came in at US$80.58 for the quarter, compared with US$47.75 a year earlier. These figures give investors a clearer view of how White Mountains Insurance Group is converting its insurance and related activities into profits on a per share basis.
Over the first six months of 2026, revenue was US$1.36 billion compared with US$1.27 billion in the prior year period. Net income for the half year was US$172.3 million versus US$156.8 million a year ago, with basic and diluted earnings per share from continuing operations of US$67.36 compared with US$60.99.
Alongside the earnings release, the company updated investors on its ongoing buyback. From April 1 to June 30, 2026, White Mountains Insurance Group repurchased 91,194 shares for US$190.84 million, equivalent to 3.73% of its shares under the program.
Since the buyback program was announced in November 2016, the company has repurchased a total of 328,769 shares for US$507.37 million, representing 12.1% of its shares. For investors following White Mountains Insurance Group, the combination of recent earnings data and completed buybacks provides fresh information to assess how the company is managing both its operations and its capital base.
White Mountains Insurance Group’s recent earnings and buyback update come as the stock trades at US$2,113.40, with a year to date share price return of 3.5% and a stronger 1 year total shareholder return of 19.9%. This indicates that longer term holders have seen more benefit than the shorter term share price trend implies.
If strong insurer results have you thinking about where capital could work next, this is a good moment to broaden your watchlist with 21 top founder-led companies
Bulls point to White Mountains Insurance Group’s earnings, buybacks and long term returns, while bears focus on the recent flat share price. Which side does the current valuation evidence support next?
Price-to-Earnings of 4.5x: Is it justified?
White Mountains Insurance Group is currently trading at a P/E of 4.5x, with a last close price of $2,113.40 and past earnings growth that has been very large.
The P/E ratio compares the company’s share price to its earnings per share. For White Mountains Insurance Group, this offers a simple way to relate the current share price to the earnings power highlighted by recent results.
WTM is flagged as good value based on this 4.5x P/E when compared with both its peer average of 9.3x and the wider US Insurance industry average of 11.5x. Earnings growth over the past year has also been very large compared with both its own 5-year pace and the industry, while net profit margins and return on equity sit in a range that some investors may consider consistent with a mature but profitable insurance group.
Result: Price-to-Earnings of 4.5x (UNDERVALUED)
However, White Mountains Insurance Group still carries risks around its complex mix of segments and the recent short term share price weakness, which could challenge the current value case.
Another View on White Mountains Insurance Group’s Valuation
The earlier P/E comparison presents White Mountains Insurance Group as relatively good value, while the SWS DCF model points to a different reference point. It suggests a fair value of about $3,583.40 per share, which is above the current $2,113.40 price and indicates the stock appears undervalued on that basis.
This model relies on future cash flow assumptions, whereas the earnings multiple reflects what the market is willing to pay today. With both approaches highlighting potential upside in different ways, the key consideration is which set of assumptions investors regard as more appropriate for White Mountains Insurance Group at this time.
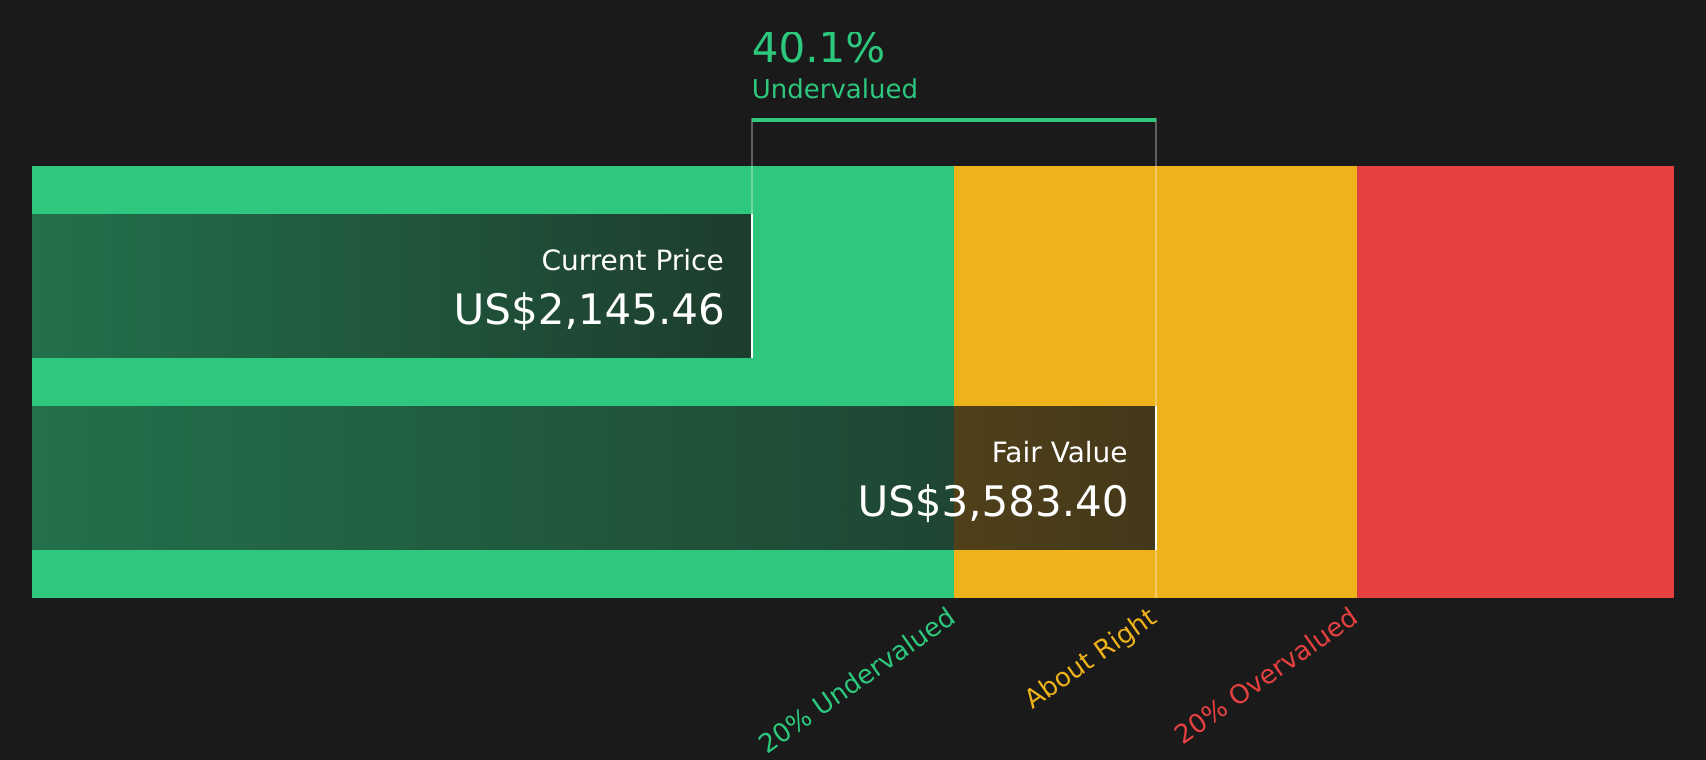
Simply Wall St performs a discounted cash flow (DCF) on every stock in the world every day (check out White Mountains Insurance Group for example). We show the entire calculation in full. You can track the result in your watchlist or portfolio and be alerted when this changes, or use our stock screener to discover 53 high quality undervalued stocks. If you save a screener we even alert you when new companies match - so you never miss a potential opportunity.
Next Steps
With mixed signals across earnings, valuation and recent share price moves, this is a useful moment to check the underlying data yourself and act quickly. To weigh both the risks that concern investors and the rewards they are optimistic about, take a closer look at the 2 key rewards and 1 important warning sign.
Looking for more investment ideas beyond White Mountains Insurance Group?
If you stop with White Mountains Insurance Group, you could miss other opportunities that fit your style. Use these focused screens to spot ideas before others do.
- Target reliable income by reviewing companies identified as potential 10 dividend fortresses that may suit investors who prioritise regular cash returns.
- Zero in on quality at a reasonable price with the screener containing 19 high quality undiscovered gems that highlight companies some investors may not yet be watching closely.
- Stress test your downside first by scanning 80 resilient stocks with low risk scores that focus on resilient companies with lower risk scores.
This article by Simply Wall St is general in nature. We provide commentary based on historical data and analyst forecasts only using an unbiased methodology and our articles are not intended to be financial advice. It does not constitute a recommendation to buy or sell any stock, and does not take account of your objectives, or your financial situation. We aim to bring you long-term focused analysis driven by fundamental data. Note that our analysis may not factor in the latest price-sensitive company announcements or qualitative material. Simply Wall St has no position in any stocks mentioned.