

Why Cigna Group (CI) Is Down 9.0% After Strong Q2 Results Meet PBM and Regulatory Jitters
Cigna Group CI | 0.00 |
- The Cigna Group reported its second-quarter 2026 results, with revenue rising to US$71.67 billion and net income to US$1.66 billion, alongside continued share repurchases under its multiyear buyback program.
- Despite this growth, recent analyst downgrades have drawn attention to regulatory pressures and uncertainty around Cigna’s pharmacy benefit management operations and business portfolio review.
- Next, we’ll examine how solid quarterly earnings but heightened PBM and regulatory concerns may alter Cigna’s previously optimistic investment narrative.
The future of work is here. Discover the 35 top robotics and automation stocks leading the charge in AI-driven automation and industrial transformation.
Cigna Group Investment Narrative Recap
To own Cigna today, you need to believe its integrated health services model, particularly Evernorth and the PBM, can keep translating large, complex healthcare demand into consistent earnings, even under pressure. The latest quarter delivered higher revenue and net income, but the real short term story is whether rising regulatory scrutiny and uncertainty around the PBM and portfolio review become more important for the share price than the solid headline numbers. So far, the earnings beat has not removed that concern.
The continued execution of Cigna’s multiyear buyback program, with an additional US$250 million of repurchases in the second quarter, stands out alongside the earnings release. While not directly addressing PBM or regulatory questions, this ongoing capital return sits in contrast to the recent analyst downgrades and keeps attention on how much of the investment case rests on earnings resilience versus the risk of future pressure on the PBM business and related income streams.
But investors also need to be aware that growing regulatory focus on PBM practices could...
Cigna Group's narrative projects $315.1 billion revenue and $7.8 billion earnings by 2029.
Uncover how Cigna Group's forecasts yield a $340.92 fair value, a 24% upside to its current price.
Exploring Other Perspectives
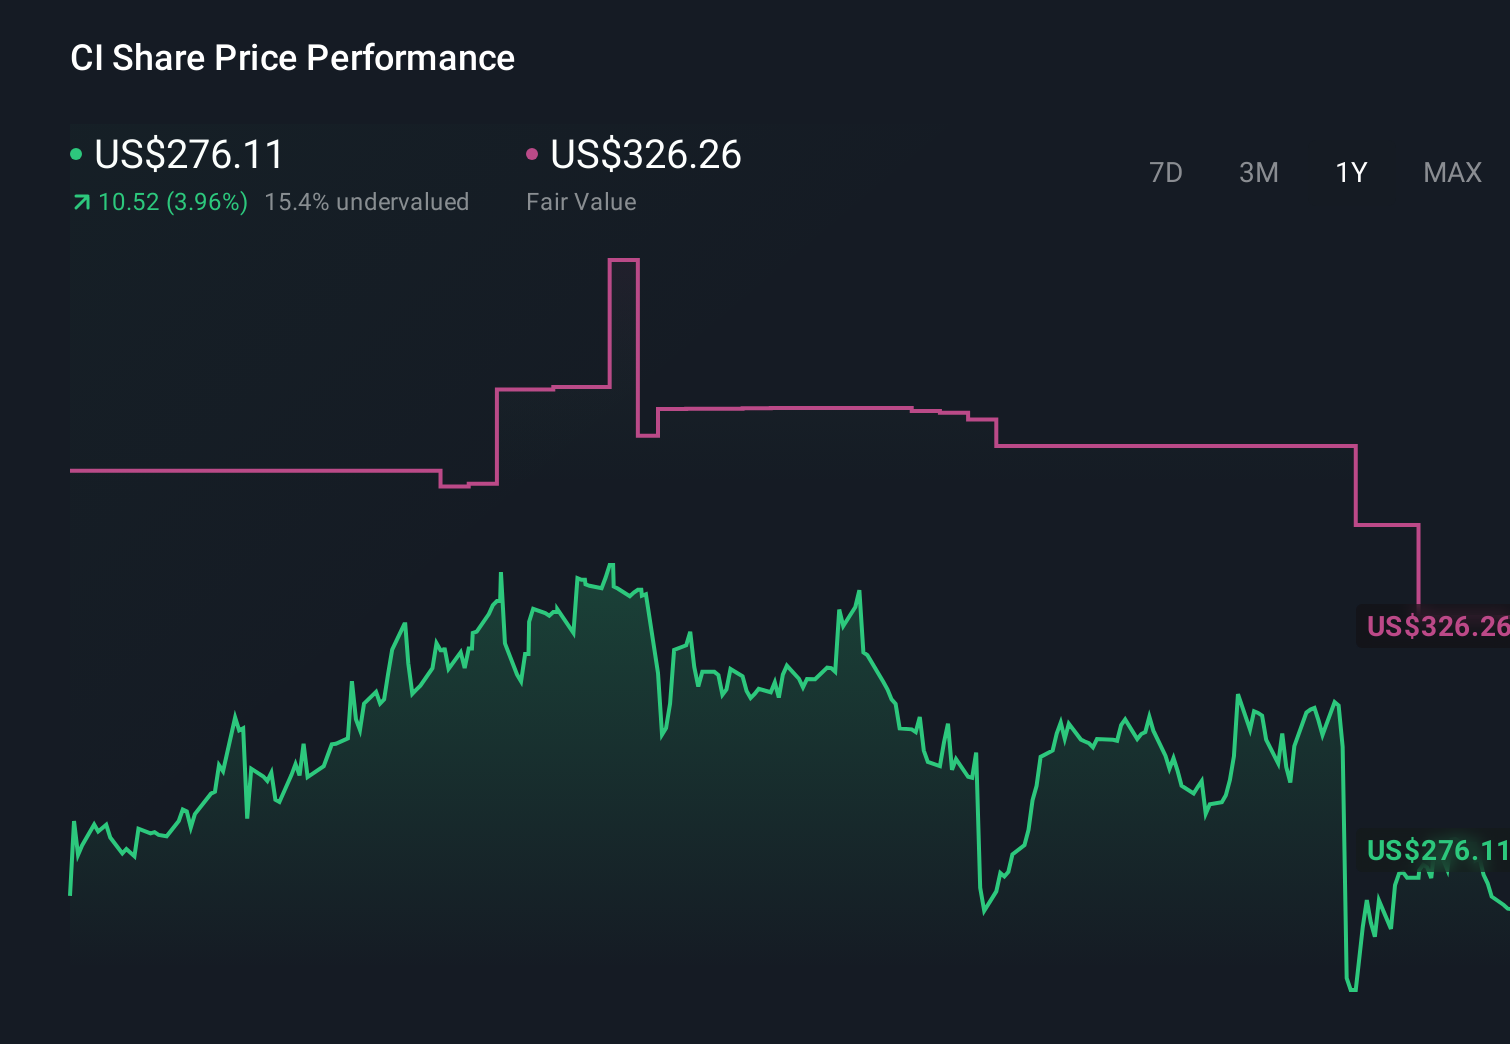
Eight fair value estimates from the Simply Wall St Community span roughly US$319 to US$902 per share, underscoring how far opinions can diverge. When you set those views against the current concerns around PBM regulation and business portfolio uncertainty, it becomes even more important to weigh several different expectations for Cigna’s future earnings power before deciding where you stand.
Explore 8 other fair value estimates on Cigna Group - why the stock might be worth over 3x more than the current price!
Form Your Own Verdict
Don't just follow the ticker - dig into the data and build a conviction that's truly your own.
- A great starting point for your Cigna Group research is our analysis highlighting 6 key rewards and 1 important warning sign that could impact your investment decision.
- Our free Cigna Group research report provides a comprehensive fundamental analysis summarized in a single visual - the Snowflake - making it easy to evaluate Cigna Group's overall financial health at a glance.
Curious About Other Options?
The market won't wait. These fast-moving stocks are hot now. Grab the list before they run:
- Capitalize on the AI infrastructure supercycle with our selection of the 56 best 'picks and shovels' of the AI gold rush converting record-breaking demand into massive cash flow.
- This technology could replace computers: discover 26 stocks that are working to make quantum computing a reality.
- AI is about to change healthcare. These 41 stocks are working on everything from early diagnostics to drug discovery. The best part - they are all under $10b in market cap - there's still time to get in early.
This article by Simply Wall St is general in nature. We provide commentary based on historical data and analyst forecasts only using an unbiased methodology and our articles are not intended to be financial advice. It does not constitute a recommendation to buy or sell any stock, and does not take account of your objectives, or your financial situation. We aim to bring you long-term focused analysis driven by fundamental data. Note that our analysis may not factor in the latest price-sensitive company announcements or qualitative material. Simply Wall St has no position in any stocks mentioned.