

Why Mohawk Industries (MHK) Is Back In The Spotlight
Mohawk Industries, Inc. MHK | 0.00 |
Mohawk Industries earnings and buyback update
Mohawk Industries (MHK) has drawn fresh attention after reporting second quarter 2026 results that show higher sales and net income compared with a year earlier, alongside progress on its ongoing share repurchase program.
The company reported second quarter sales of US$2,991.4 million versus US$2,802.1 million a year earlier. Net income was US$196.1 million compared with US$146.5 million, with basic earnings per share from continuing operations at US$3.23 versus US$2.35.
At a share price of US$136.86, Mohawk Industries has seen a 30-day share price return of 27.12% and a 90-day share price return of 38.61%. The 1-year total shareholder return of 3.20% contrasts with a 5-year total shareholder return that declined 30.83%, suggesting recent momentum has picked up after a weaker multiyear period.
If Mohawk’s recent earnings and buybacks have you thinking about where else capital is moving, this is a good moment to scan 36 power grid technology and infrastructure stocks for potential ideas across critical infrastructure themes.
Mohawk Industries now appears to be a sturdier business than its 5 year share price record might suggest. After such a sharp recent move, the key question is whether the stock already reflects that strength or still leaves some valuation room.
Most Popular Narrative: 13.6% Overvalued
Mohawk Industries last closed at $136.86, which sits above the most followed narrative fair value of $120.47 that is anchored on detailed earnings and margin assumptions.
Strategic investments in sustainability including product circularity, material optimization, and green energy are positioning Mohawk to capture premium pricing and expanded margins as more customers seek environmentally friendly flooring solutions. Ongoing digital and operational transformation through technology upgrades, automation, and supply chain optimization is projected to improve operational efficiency and drive net margin enhancement over the long term.
Want to see what is baked into that $120.47 fair value for Mohawk Industries? The narrative leans on measured revenue growth, firmer margins and a lower future earnings multiple than today. The real story is in how those levers interact over several years.
Result: Fair Value of $120.47 (OVERVALUED)
However, you still need to weigh softer consumer demand and persistent cost pressures, which could squeeze Mohawk Industries’ margins and challenge the current overvaluation narrative.
Another view on Mohawk Industries valuation
The SWS DCF model points in a different direction to the overvaluation story. On this view, Mohawk Industries at $136.86 is trading around 4.1% below an estimated future cash flow value of $142.70, which frames the current price as slightly discounted rather than stretched. Which signal do you treat as more important?
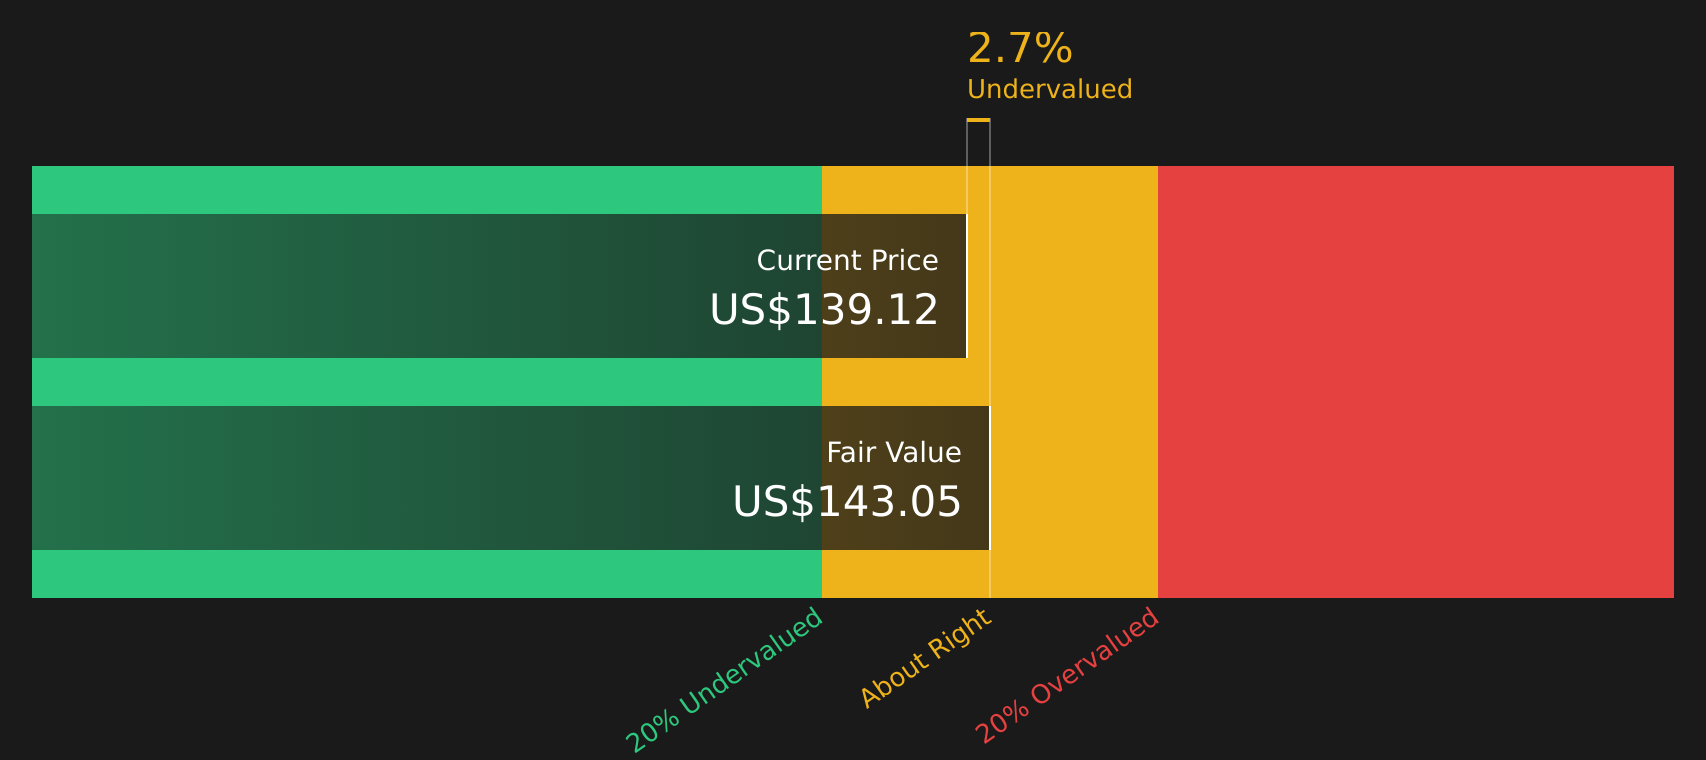
Simply Wall St performs a discounted cash flow (DCF) on every stock in the world every day (check out Mohawk Industries for example). We show the entire calculation in full. You can track the result in your watchlist or portfolio and be alerted when this changes, or use our stock screener to discover 49 high quality undervalued stocks. If you save a screener we even alert you when new companies match - so you never miss a potential opportunity.
Next Steps
If the mixed signals around Mohawk Industries leave you unsure, that is a useful starting point. While the details are fresh, consider reviewing the 2 key rewards and 2 important warning signs.
Looking for more investment ideas beyond Mohawk Industries?
If Mohawk Industries has sharpened your focus on opportunities, do not stop here. Broaden your watchlist now so you are not chasing ideas after they move.
Scan for potential long term compounders with 49 high quality undervalued stocks that pair quality fundamentals with prices that may sit below estimated fair value.
Strengthen your search for stability by checking the solid balance sheet and fundamentals stocks screener (49 results) that highlights companies with healthier finances and fewer balance sheet red flags.
Hunt for off the radar opportunities inside the screener containing 20 high quality undiscovered gems before more investors start paying attention and competition for those ideas heats up.
This article by Simply Wall St is general in nature. We provide commentary based on historical data and analyst forecasts only using an unbiased methodology and our articles are not intended to be financial advice. It does not constitute a recommendation to buy or sell any stock, and does not take account of your objectives, or your financial situation. We aim to bring you long-term focused analysis driven by fundamental data. Note that our analysis may not factor in the latest price-sensitive company announcements or qualitative material. Simply Wall St has no position in any stocks mentioned.