Will Exelon's (EXC) Revenue Gain and Reaffirmed Targets Reset Its Long-Term Earnings Narrative?
Exelon Corporation EXC | 0.00 |
- In the past quarter ended March 31, 2026, Exelon Corporation reported Q1 revenue of US$7,242 million, up from US$6,714 million a year earlier, with net income of US$919 million and basic and diluted earnings per share from continuing operations steady at US$0.90.
- Although earnings per share were flat year over year, Exelon’s ability to lift revenue while reaffirming its longer-term operating earnings growth targets underscores management’s confidence in the current capital investment and demand outlook.
- Against this backdrop of revenue growth and reaffirmed long-term earnings targets, we’ll explore how Exelon’s latest results influence its investment narrative.
Find 54 companies with promising cash flow potential yet trading below their fair value.
Exelon Investment Narrative Recap
To own Exelon, you need to be comfortable with a regulated utility story tied to grid investment, large-load growth and constructive regulators. The latest Q1 result, with higher revenue but flat earnings per share and reaffirmed long term operating earnings targets, does not materially change the near term focus on securing favorable rate outcomes, nor the key risk that regulatory or financing constraints could limit recovery of rising grid and storm related costs.
Among recent announcements, the PJM approved 220 mile 765 kV transmission project with NextEra stands out, because it speaks directly to Exelon’s core catalyst of expanding its regulated asset base through large transmission and reliability investments. How efficiently this kind of long dated, capital intensive build is financed and recovered through rates will be a central test of the earnings growth framework that management just reaffirmed.
However, investors should also keep in mind the risk that escalating grid modernization and transmission spending could run ahead of...
Exelon’s narrative projects $27.3 billion revenue and $3.5 billion earnings by 2029. This requires 3.3% yearly revenue growth and about a $0.7 billion earnings increase from $2.8 billion today.
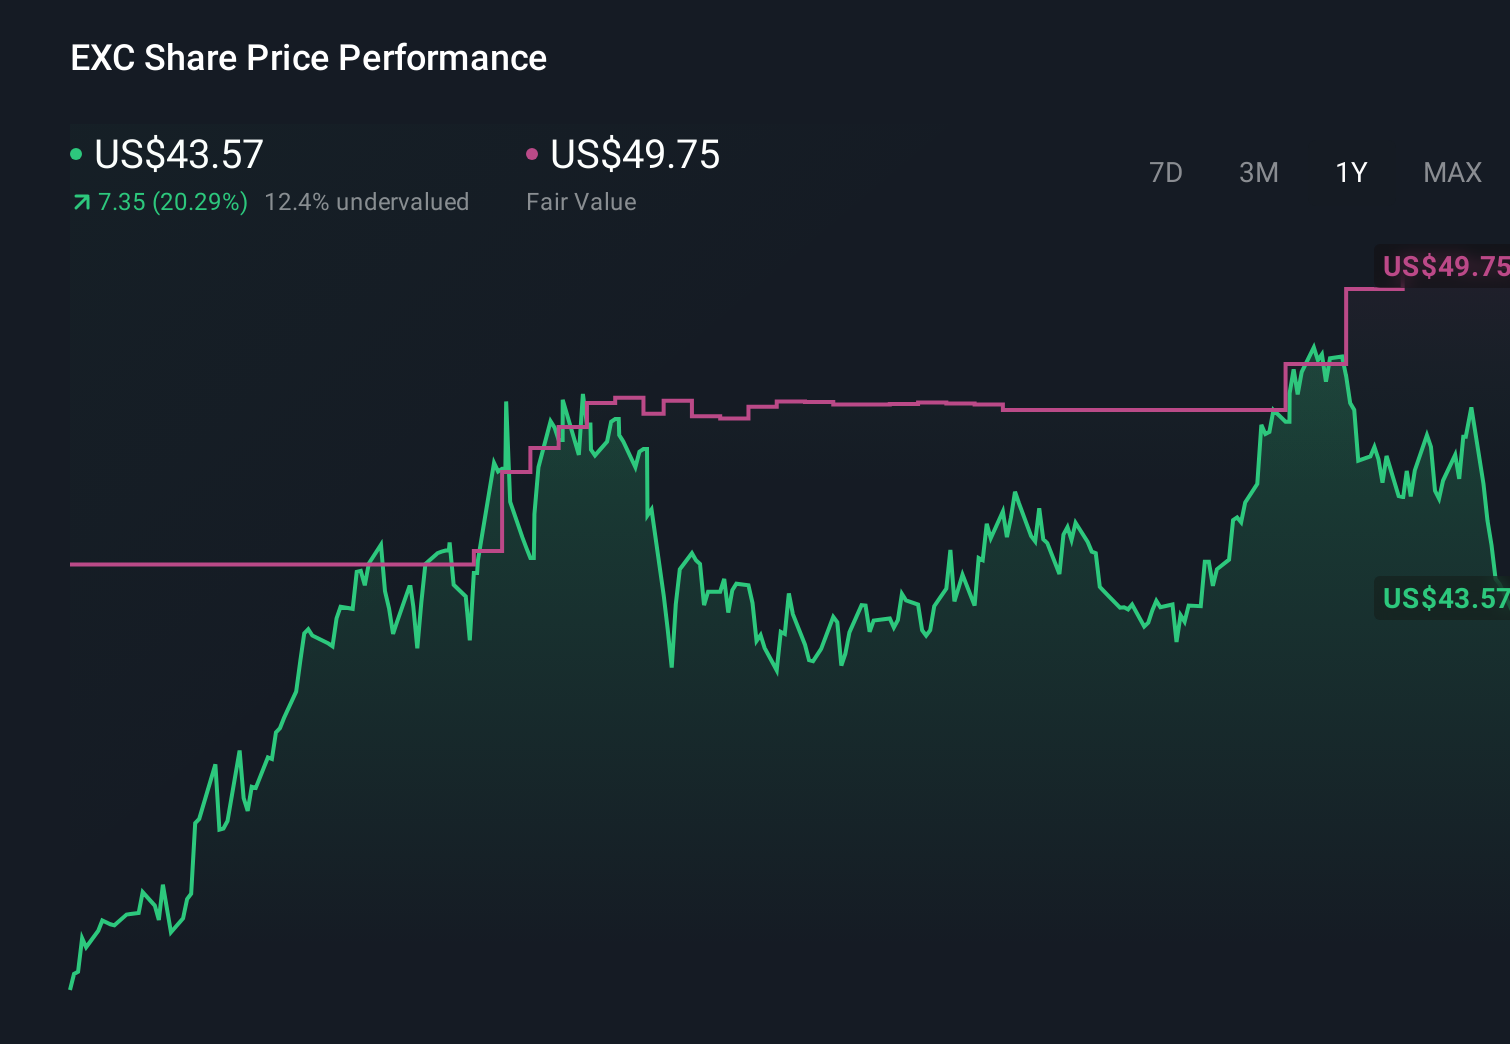
Uncover how Exelon's forecasts yield a $49.56 fair value, a 11% upside to its current price.
Exploring Other Perspectives
Two fair value estimates from the Simply Wall St Community range widely, from about US$5 to roughly US$50 per share, showing just how far apart individual views can be. Set against this, Exelon’s reliance on regulatory approval for recovering growing grid and transmission investment costs may be a key factor you want to explore through several different lenses before deciding where you stand.
Explore 2 other fair value estimates on Exelon - why the stock might be worth as much as 11% more than the current price!
Reach Your Own Conclusion
Don't just follow the ticker - dig into the data and build a conviction that's truly your own.
- A great starting point for your Exelon research is our analysis highlighting 4 key rewards and 2 important warning signs that could impact your investment decision.
- Our free Exelon research report provides a comprehensive fundamental analysis summarized in a single visual - the Snowflake - making it easy to evaluate Exelon's overall financial health at a glance.
Seeking Other Investments?
Our daily scans reveal stocks with breakout potential. Don't miss this chance:
- Invest in the nuclear renaissance through our list of 88 elite nuclear energy infrastructure plays powering the global AI revolution.
- We've uncovered the 12 dividend fortresses yielding 5%+ that don't just survive market storms, but thrive in them.
- The future of work is here. Discover the 31 top robotics and automation stocks leading the charge in AI-driven automation and industrial transformation.
This article by Simply Wall St is general in nature. We provide commentary based on historical data and analyst forecasts only using an unbiased methodology and our articles are not intended to be financial advice. It does not constitute a recommendation to buy or sell any stock, and does not take account of your objectives, or your financial situation. We aim to bring you long-term focused analysis driven by fundamental data. Note that our analysis may not factor in the latest price-sensitive company announcements or qualitative material. Simply Wall St has no position in any stocks mentioned.