

Will Hubbell's (HUBB) Index Removal and Premium Valuation Shift Its Earnings-Driven Narrative?
Hubbell Incorporated HUBB | 0.00 |
- Hubbell Incorporated was recently removed from the Russell 1000 Dynamic Index, even as it continues to post earnings results that outperform analyst expectations.
- At the same time, renewed analyst optimism reflected in a Zacks Rank #2 (Buy) rating and positive earnings sentiment has put a spotlight on whether Hubbell’s fundamentals justify perceptions that the shares may be trading above estimated fair value.
- We’ll now examine how Hubbell’s removal from the Russell 1000 Dynamic Index may influence its existing investment narrative and future assumptions.
Invest in the nuclear renaissance through our list of 89 elite nuclear energy infrastructure plays powering the global AI revolution.
Hubbell Investment Narrative Recap
To own Hubbell, you need to believe its utility and electrical solutions can keep benefiting from grid modernization and data center demand, while pricing and productivity actions offset rising input costs and tariffs. The recent removal from the Russell 1000 Dynamic Index looks more like a technical setback than a change in the business story, but the key near term risk remains pressure on margins if cost inflation and tariffs bite faster than Hubbell can respond.
Against that backdrop, the most relevant recent announcement is the Zacks Rank #2 (Buy) upgrade, which leans on Hubbell’s pattern of modest earnings beats and positive estimate revisions. This upbeat earnings sentiment sits uncomfortably beside concerns that the shares trade above some fair value estimates, highlighting how sensitive the stock could be if earnings momentum slows or margin pressures from tariffs and grid automation competition intensify.
Yet behind the optimism around earnings beats, one risk investors should be aware of is how persistent tariff and raw material cost pressures could...
Hubbell's narrative projects $7.3 billion revenue and $1.2 billion earnings by 2029.
Uncover how Hubbell's forecasts yield a $550.77 fair value, a 15% upside to its current price.
Exploring Other Perspectives
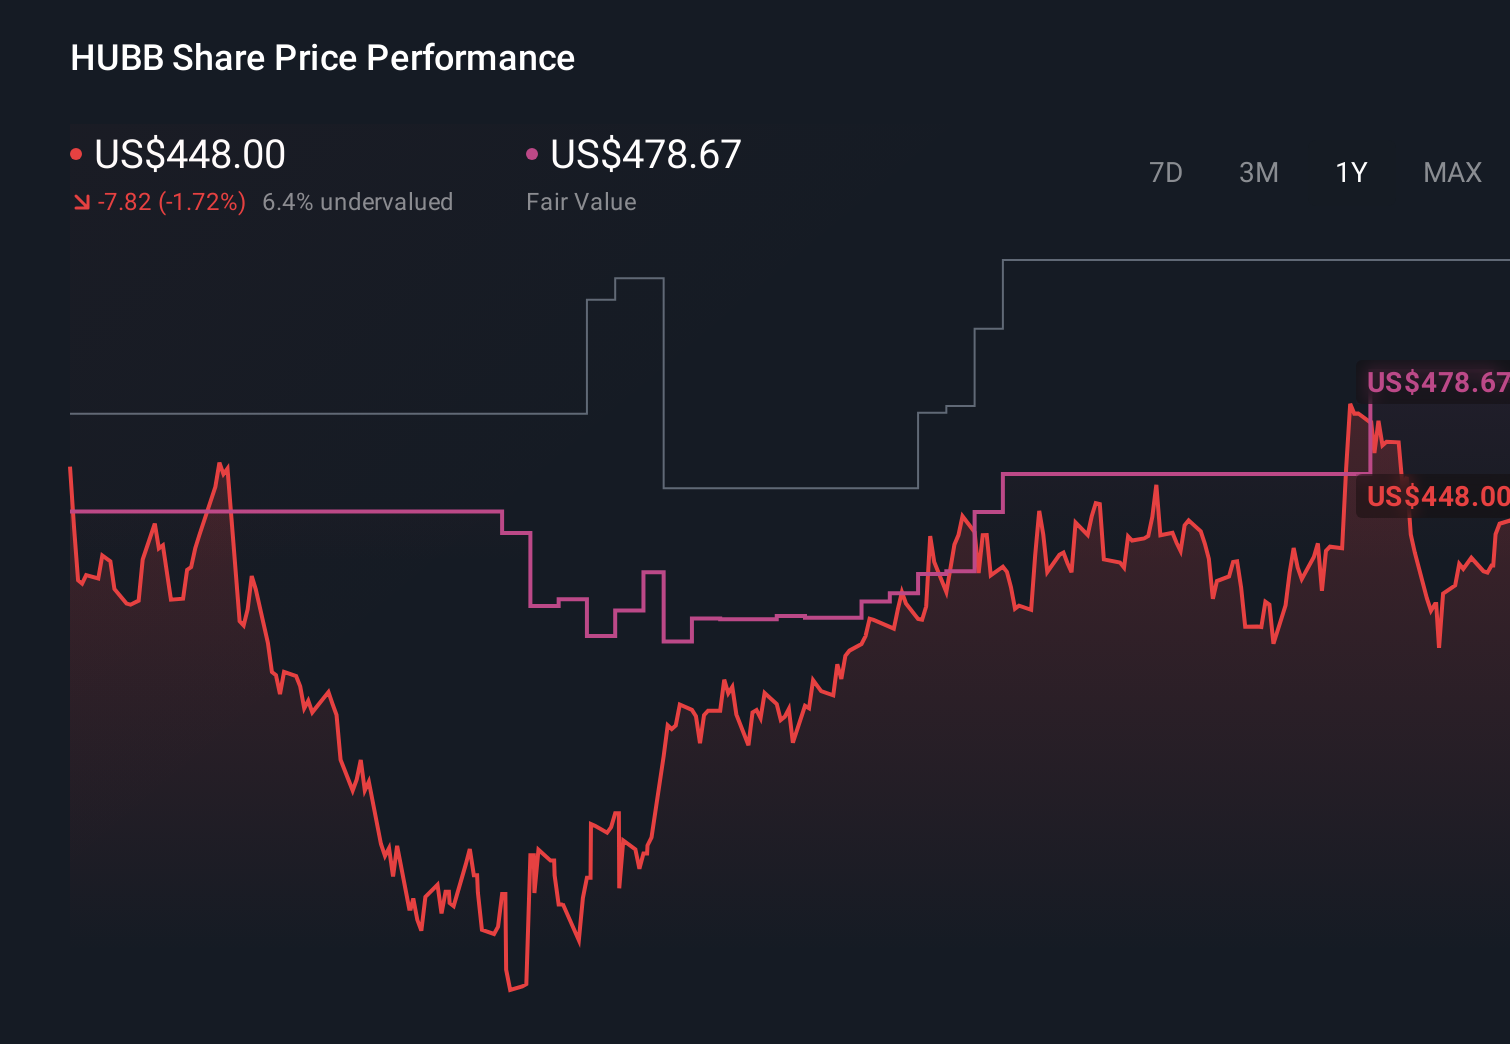
Some of the most optimistic analysts were penciling in revenue of about US$8.4 billion and earnings near US$1.2 billion by 2029, which is far more upbeat than consensus and assumes tariff headwinds and telecom or utility softness ease meaningfully; after an index removal and valuation concerns, you should expect that views like this may be revisited and compare them with more cautious takes before deciding what you believe.
Explore 3 other fair value estimates on Hubbell - why the stock might be worth 11% less than the current price!
Decide For Yourself
Disagree with existing narratives? Extraordinary investment returns rarely come from following the herd, so go with your instincts.
- A great starting point for your Hubbell research is our analysis highlighting 4 key rewards and 1 important warning sign that could impact your investment decision.
- Our free Hubbell research report provides a comprehensive fundamental analysis summarized in a single visual - the Snowflake - making it easy to evaluate Hubbell's overall financial health at a glance.
Looking For Alternative Opportunities?
Right now could be the best entry point. These picks are fresh from our daily scans. Don't delay:
- The future of work is here. Discover the 30 top robotics and automation stocks leading the charge in AI-driven automation and industrial transformation.
- The latest GPUs need a type of rare earth metal called Terbium and there are only 29 companies in the world exploring or producing it. Find the list for free.
- Uncover the next big thing with 20 elite penny stocks that balance risk and reward.
This article by Simply Wall St is general in nature. We provide commentary based on historical data and analyst forecasts only using an unbiased methodology and our articles are not intended to be financial advice. It does not constitute a recommendation to buy or sell any stock, and does not take account of your objectives, or your financial situation. We aim to bring you long-term focused analysis driven by fundamental data. Note that our analysis may not factor in the latest price-sensitive company announcements or qualitative material. Simply Wall St has no position in any stocks mentioned.