

Winmark (WINA) Pulls Back As Valuation Stays Rich, Is The Premium Still Justified?
Winmark Corporation WINA | 0.00 |
Winmark stock performance snapshot after recent moves
Winmark (WINA) has seen mixed share price performance recently, with the stock up roughly 0.4% over the past day but down about 7% over the past week and 9.6% over the past month.
Over the past 3 months the stock is close to flat and the year-to-date return is down about 12.6%. The 1-year total return has declined about 17.5%, while the 3-year total return is about 7.1% and the 5-year total return is roughly 9.8 times.
For Winmark, the recent 7-day share price return of down 7.2% and 30-day share price return of down 9.6% contrast with a 5-year total shareholder return of about 98.5%. This points to fading short term momentum alongside a stronger long term record.
If you are reassessing Winmark after this pullback, it can also be useful to broaden your search and check out 21 top founder-led companies
Bulls see Winmark’s resale franchises and equipment leasing as worth a premium. Bears point to the recent pullback and question that pricing. The next step is to see which side current valuation evidence leans toward.
Price-to-Earnings of 30.9x: Is it justified?
Winmark closed at $351.01, and on a P/E of 30.9x the stock trades at a premium to both its industry and its own estimated fair multiple.
The P/E ratio compares Winmark's share price with its earnings per share, so it captures how much investors are currently willing to pay for each dollar of profit. For a mature, profitable franchising and leasing business, this often reflects expectations around the durability of earnings and the predictability of cash flows.
In Winmark's case, earnings are forecast to grow 8.5% per year, which is slower than both the broader US market and the US market revenue growth forecast. The current P/E of 30.9x sits well above the US Specialty Retail industry average of 19.9x, and also above the estimated fair P/E of 12.4x that the fair ratio model points to as a level the market could potentially move toward if expectations cool.
Result: Price-to-Earnings of 30.9x (OVERVALUED)
However, there are clear risks. A P/E well above the Specialty Retail average and slower forecast earnings growth could leave Winmark exposed if sentiment or franchise economics weaken.
Another view on Winmark using our DCF model
The P/E suggests Winmark looks expensive, yet our DCF model points to a fair value of about $302.68 per share. With the stock at $351.01, that implies it trades above this estimate. Which signal you rely on may depend on how you weigh risk versus potential reward.
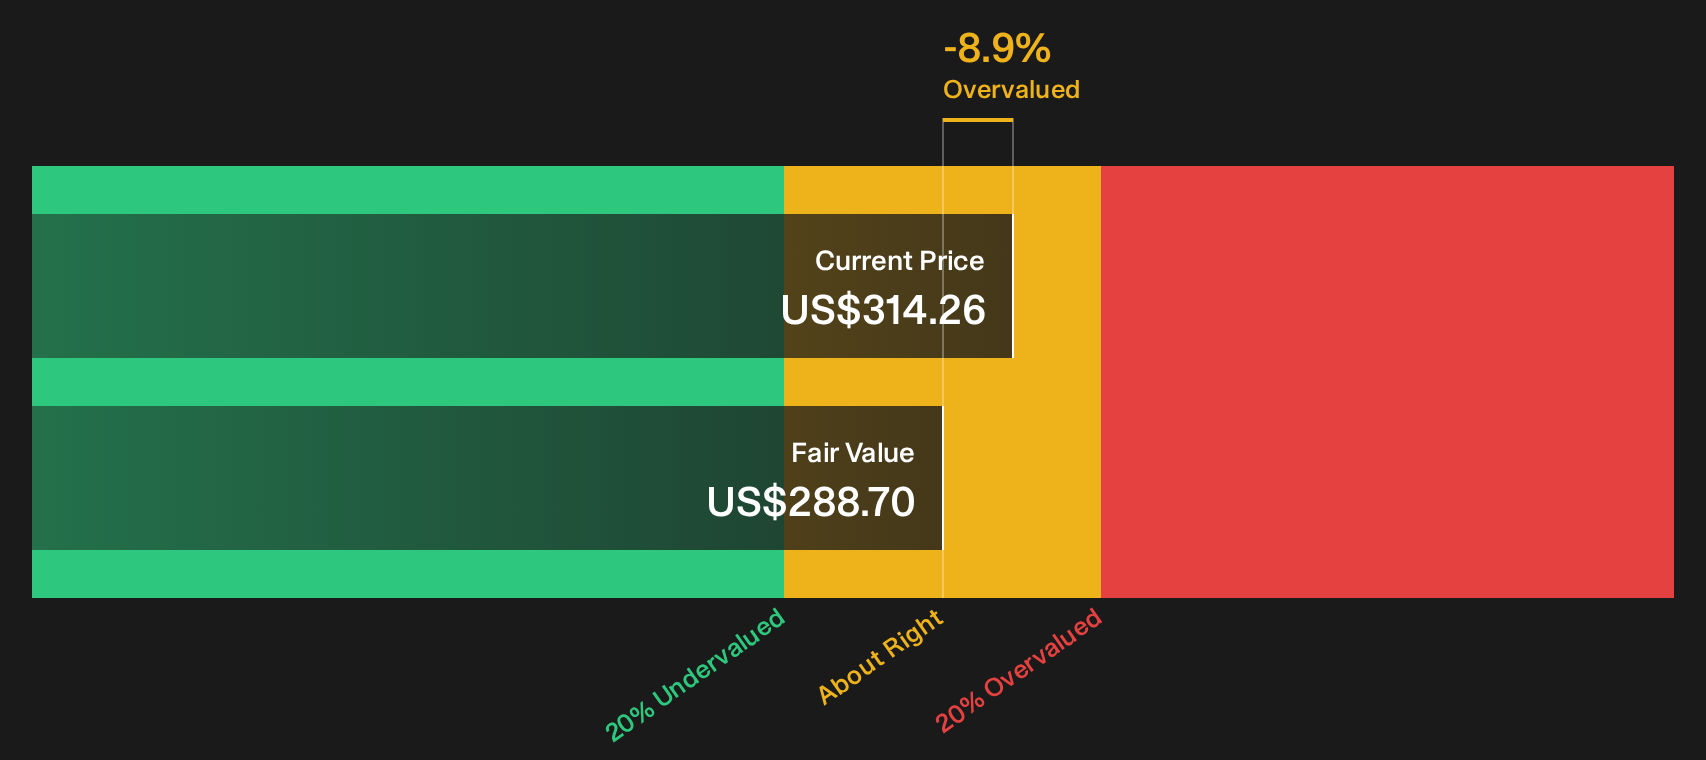
Simply Wall St performs a discounted cash flow (DCF) on every stock in the world every day (check out Winmark for example). We show the entire calculation in full. You can track the result in your watchlist or portfolio and be alerted when this changes, or use our stock screener to discover 52 high quality undervalued stocks. If you save a screener we even alert you when new companies match - so you never miss a potential opportunity.
Next Steps
With Winmark showing both pressure on recent returns and a richer valuation, the sentiment is clearly mixed. Act quickly by reviewing the underlying data, then weigh the potential upside against the concerns using our breakdown of 1 key reward and 3 important warning signs
Looking for more investment ideas beyond Winmark?
Winmark is only one piece of the puzzle. If you stop here, you could miss out on other stocks that better match your goals and risk comfort.
- Target potential mispricing opportunities by checking companies that screen as quality and possibly overlooked through the 52 high quality undervalued stocks.
- Prioritise resilience by reviewing stocks that pass strict balance sheet and fundamentals checks via the solid balance sheet and fundamentals stocks screener (50 results).
- Spot potential early-stage standouts by scanning a screener containing 19 high quality undiscovered gems that surfaces companies many investors may not be watching yet.
This article by Simply Wall St is general in nature. We provide commentary based on historical data and analyst forecasts only using an unbiased methodology and our articles are not intended to be financial advice. It does not constitute a recommendation to buy or sell any stock, and does not take account of your objectives, or your financial situation. We aim to bring you long-term focused analysis driven by fundamental data. Note that our analysis may not factor in the latest price-sensitive company announcements or qualitative material. Simply Wall St has no position in any stocks mentioned.