We Value Your Feedback! Help us shape better content and experiences by participating in our survey. Join the Survey Now!
Company Overview:
Perfect Presentation for Commercial Services Company (2P, stock code: 7204.SR) is a leading integrated ICT service and technology solution provider in Saudi Arabia, headquartered in Riyadh. Founded in 2004, the company was formerly a sole proprietorship. It was transformed into a closed joint-stock company in 2021 and successfully listed on the Saudi Main Market (Tadawul) in November 2022, becoming the 13th listed company of the year. The company's current market value is approximately 3.522 billion Saudi riyals (approximately US$939 million), with 3,881 employees and main operating bases in Riyadh and Mecca.
2P provides a full range of digital services through three core business units: the software solutions department is responsible for customized software development and technology platform construction; the operation and maintenance department provides IT infrastructure management and professional technical labor support; the customer experience department focuses on omnichannel customer interaction solutions, including contact center operations and customer journey design. This vertically integrated business model enables the company to provide customers with end-to-end ICT services, meeting the full stack needs from infrastructure to front-end interaction.
Business Line Structure and Revenue Composition
2P's business model is built on three highly synergistic business units, forming a complete coverage of the ICT value chain:
Software Licensing and Development (SWD) Department: This department is the company's technical core, providing software design, development, customized solutions and electronic platform management services. The department covers the entire life cycle management from demand analysis to system delivery, with a special focus on building dedicated systems for large organizations. In 2024, the department contributed 294 million riyals in revenue, accounting for 27.5% of the company's total revenue. Services include enterprise-level application development, open source contact center systems (such as automatic call distribution ACD), interactive voice response (IVR) systems, customer relationship management (CRM) platforms, and real-time data analysis dashboards.
Operation and Maintenance Services Department: As the company's infrastructure pillar, it provides IT system operation and maintenance and professional technical personnel services. The department not only provides preventive and corrective maintenance, but also provides data center hosting services and technical manpower outsourcing to ensure the continuous and stable operation of customer systems. In 2024, the department generated revenue of 344 million riyals, accounting for 32.1%. The service model includes fully managed services based on SLA and on-demand technical support, covering a wide range of needs from traditional hardware maintenance to cloud infrastructure management.
Customer Experience Department: This department is the company's front-end interface, focusing on designing and optimizing customer journeys and managing omnichannel customer interactions. Services cover traditional contact center operations, social media management, digital channel (chatbots, email, instant messaging) integration, and customer experience analysis. In 2024, the department achieved revenue of 298 million riyals, accounting for 27.8%. It is worth noting that the company recently expanded "social services" (Mother Services Social), which specializes in providing customized customer experience solutions for social service agencies, generating revenue of 29.48 million riyals in 2024.
Revenue Evolution and Growth Drivers
2P's revenue growth trajectory reflects the expansion of the Saudi ICT market. From 2020 to 2023, the company's revenue has achieved a significant leap, from 482 million riyals to 1.13 billion riyals, with a compound annual growth rate (CAGR) of 33.5%, far exceeding the industry average. This growth is mainly due to the government digitalization wave driven by Saudi Arabia's "Vision 2030" and the demand for technology upgrades in the private sector.
However, the 2024 financial data showed that the company's revenue fell slightly to 1.07 billion riyals, a year-on-year decrease of about 5.3%. This change may reflect several key trends: fluctuations in the government project cycle have led to the postponement or phased implementation of some large projects; intensified market competition has compressed profit margins; and customer budget optimization has had a short-term suppression on demand for high-end services. It is worth noting that despite the decline in total revenue, the company's newly launched "Managed Services" business line achieved revenue of 105 million riyals in 2024, showing its successful attempt to diversify its services.
Industry analysis:
2P’s competitive position in the Saudi ICT market is built on several key advantages:
Government Trust and Compliance Capabilities: The company has security certifications and data compliance qualifications to serve sensitive government agencies, which is a key barrier to entry into the Saudi public sector market. Through long-term service on government projects, 2P has established deep institutional knowledge and understanding of compliance frameworks, enabling it to efficiently meet the complex procurement requirements of the public sector. This advantage is reflected in the company’s 88.7% share of government revenue.
Full-stack technology integration capabilities: The company has end-to-end service capabilities covering the ICT value chain, from back-end infrastructure management to middleware development to front-end customer interaction systems. This integration capability enables customers to simplify supplier management and reduce multi-vendor coordination costs, which is particularly valuable in large-scale digital projects. The company has independently developed core technology platforms, including contact center systems, CRM solutions and real-time analytical tools, which have been proven in government and large enterprise environments.
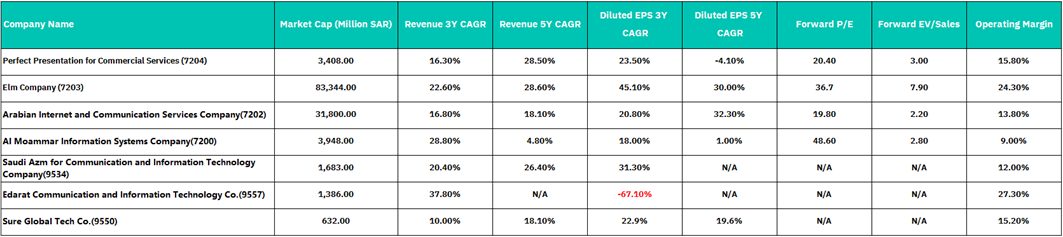
Comparison of competing companies
The Saudi commercial services and technology sector exhibits significant market capitalization disparity, ranging from SAR 632 million (Sure Global Tech) to SAR 83.3 billion (Elm Company). Within this landscape, 2P occupies a lower-mid tier position, commanding approximately 4% of sector leader Elm's market cap at SAR 3.4 billion, placing it alongside comparable peers like Al Moammar Information Systems (SAR 3.9B) but substantially below dominant players Elm (SAR 83.3B) and Arabian Internet & Communication Services (SAR 31.8B). Financially, 2P demonstrates a mixed profile: its revenue growth shows a solid 5-year CAGR of 28.50%, yet this underperforms the sector median (~20%) over 3 years (16.30% CAGR) and lags top-tier competitors like Elm and Arabian Internet. Profitability analysis reveals a strong 3-year diluted EPS CAGR of 23.50%, contrasting sharply with a concerning 5-year EPS decline of -4.10%. Its operating margin of 15.80% positions it mid-tier, above peers Arabian Internet and Al Moammar but below sector leaders Edarat and Elm.
2P trades at a significant discount to sector valuation multiples, presenting an attractive entry point based on relative value. Its forward P/E of 20.40x and forward EV/Sales of 3.00x are conservative compared to the broader sector; this stands in stark contrast to the premium valuations commanded by peer Al Moammar (48.6x P/E, 2.8x EV/Sales) and the sector average exemplified by leader Elm (36.7x P/E, 7.9x EV/Sales). This valuation discount persists despite 2P maintaining decent operational competence, as evidenced by its mid-tier operating margin. Key strengths supporting this valuation assessment include its established position within the growing Saudi tech sector and recent positive earnings momentum. However, this discount also reflects material concerns, including below-average recent revenue growth relative to sector leaders, a persistent scale disadvantage compared to larger, better-resourced competitors. Recent revenue growth decreased, indicating market share erosion.
The investment thesis for 2P balances its current attractive valuation discount against fundamental concerns regarding its long-term trajectory. While the stock appears undervalued based on peer multiple analysis and potential margin improvement, significant structural challenges are evident, primarily concerning long-term decline in profitability (-4.1% 5-year EPS CAGR) and lagging revenue growth. Key risk factors demanding close monitoring include intense competitive pressure from larger players, vulnerability to rapid technological disruption inherent in the sector, exposure to broader economic cycles impacting commercial services, and execution risk in reversing the earnings decline.
Valuation:
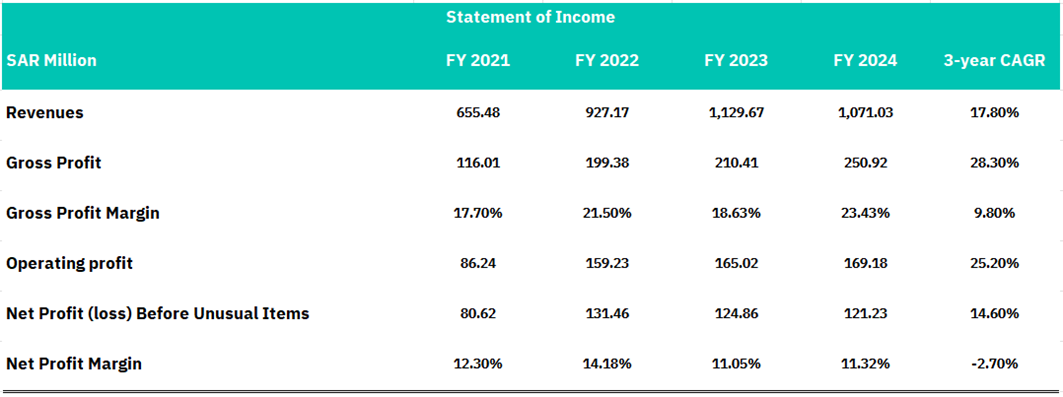
2P exhibited robust growth over three years, with revenue surging from SAR 655.48 million to SAR 1,129.67 million between FY2021 and FY2023. This expansion was driven initially by explosive 41.5% YoY growth in FY2022 (SAR 271.69 million increase), indicative of exceptional market penetration, potential new market entries, or major contract wins. Growth momentum remained strong in FY2023 at 21.8% (SAR 202.50 million increase), reflecting effective operational scaling as revenue approached the significant milestone of SAR 1.1 billion.
However, FY2024 marked a concerning inflection point, with revenue contracting by 5.2% (SAR 58.64 million decline) to SAR 1,071.03 million. This reversal breaks the prior growth trajectory and potentially signals market saturation, intensified competitive pressures, economic headwinds, or loss of key contracts. Despite maintaining a strong 3-year CAGR of 17.8%, the recent revenue deceleration and outright contraction raise significant concerns about sustainable growth, necessitating strategic reassessment and potential new growth initiatives.
Gross profit margin exhibited significant volatility, rising sharply to 21.50% (+380 bps) in FY2022, likely due to pricing power, cost optimization, or favorable mix shifts, before contracting to 18.63% (-287 bps) in FY2023 because of inflationary pressures and integration costs. A robust 480 bp recovery to 23.43% in FY2024 demonstrated management's operational effectiveness through cost controls and efficiency gains. Operating profit displayed greater stability, with margins (13.16% → 17.17% → 14.61% → 15.79%) benefiting from scale-driven fixed cost absorption. Notably, operating profit grew 2.5% in FY2024 despite a 5.2% revenue decline, highlighting defensive resilience through disciplined cost management and SG&A leverage.
Net profit before unusual items revealed critical margin erosion, declining from a peak of 14.18% in FY2022 to 11.05% (-313 bps) in FY2023 and marginally recovering to 11.32% in FY2024. This compression occurred despite gross margin recovery, from higher interest expenses, tax burdens, and non-operating charges. The resultant 3-year net margin CAGR of -2.70% signals structural profitability challenges, suggesting potential overinvestment in growth at the expense of earnings quality.
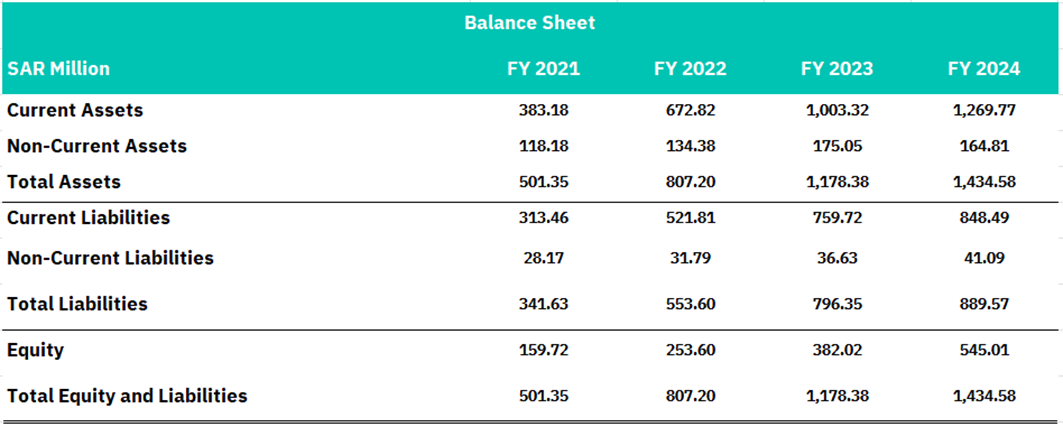
2P demonstrated extraordinary asset base growth, with total assets surging at a 41.8% 3-year CAGR from SAR 501.35 million to SAR 1,434.58 million. This expansion was predominantly driven by current assets, which grew 232% over the period and constituted 88.5% of total assets by FY2024. The extreme working capital intensity reflects significant investments in inventory buildup, accounts receivable expansion, and operational cash requirements. While current asset growth decelerated from +75.6% (FY2022) to +26.6% (FY2024), non-current assets remained relatively stable, with a 5.8% decline in FY2024 indicating reduced capital expenditures, asset disposals, or impairment events.
Despite the aggressive asset accumulation, the company exhibits deteriorating capital efficiency. Asset turnover ratio declined materially from 1.31x (FY2021) to 0.75x (FY2024), signaling diminishing revenue generation per unit of invested capital. This trend raises fundamental questions about the sustainability of the working capital-intensive model and indicates potential overinvestment without commensurate revenue scalability. The widening gap between asset growth (21.7% in FY2024) and revenue contraction (-5.2%) underscores structural inefficiencies requiring urgent management attention.
Current liabilities expanded significantly by 170% over three years (SAR 313.46M → SAR 848.49M), albeit with decelerating growth rates from +67.4% (FY2022) to +11.7% (FY2024). This surge reflects substantial operational financing needs, primarily supporting working capital requirements. Despite this expansion, the current liability growth trailed the 232% increase in current assets, resulting in a positive net working capital position of SAR 421.28 million by FY2024. While this indicates structural liquidity adequacy, it concurrently signifies material capital allocation to operational funding.
Leverage & Capital Structure: Non-current liabilities demonstrated moderate growth (+45.9% over three years), suggesting strategic term debt utilization for growth financing, potentially encompassing equipment leases or bond issuances. Critically, the debt-to-equity ratio improved from 2.14x (FY2021) to 1.63x (FY2024), indicating successful deleveraging driven primarily by robust equity growth. This transition reflects a strengthening balance sheet foundation, though the remaining moderate leverage warrants ongoing monitoring for interest rate exposure and debt service capacity.
2P has demonstrated exceptional shareholder capital accretion, with equity growing at a remarkable 50.6% 3-year CAGR from SAR 159.72 million to SAR 545.01 million. This sustained expansion pattern—registering +58.8% (FY2022), +50.6% (FY2023), and +42.7% (FY2024)—signifies systematic equity base fortification. The growth drivers include substantial retained earnings accretion from cumulative profitability.
Balance Sheet Implications: This equity explosion has fundamentally transformed the capital structure, enabling significant deleveraging as evidenced by the debt-to-equity ratio improving from 2.14x to 1.63x.
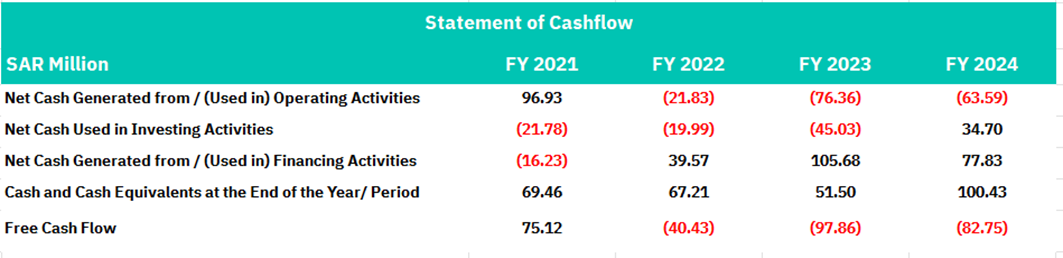
2P exhibits a severe and persistent deterioration in operating cash flow (OCF), transitioning from a healthy SAR 96.93 million generation in FY2021 to deeply negative territory: (SAR 21.83M) in FY2022, (SAR 76.36M) in FY2023, and (SAR 63.59M) in FY2024. This three-year negative OCF trend represents a fundamental cash conversion crisis, despite sustained positive net profitability. The divergence between accounting profits and cash generation is alarming, with OCF-to-net profit variances widening to negative SAR 153.29 million (FY2022), SAR 201.22 million (FY2023), and SAR 184.82 million (FY2024).
The primary driver of this cash flow collapse is explosive working capital expansion, particularly in receivables and inventory, as evidenced by the 232% current asset growth previously noted. This indicates severe capital efficiency erosion, where revenue growth and profitability are being achieved at the cost of massive cash absorption in operations. The modest FY2024 improvement remains insufficient, signaling structural rather than temporary challenges. This unsustainable cash conversion profile raises existential questions about the viability of the business model absent immediate working capital optimization and cash management.
2P maintained consistent capital expenditure outflows from FY2021-FY2023, averaging SAR 28.93 million annually, peaking at SAR 45.03 million in FY2023. This pattern reflects sustained investment in growth infrastructure during its expansion phase. However, FY2024 marked a striking reversal with positive investment cash flow of SAR 34.70 million. This material inflow likely signifies active asset monetization through divestitures, business unit sales, or equipment liquidations. The timing coincides with severe operating cash flow deficits, suggesting potential balance sheet repair measures to offset working capital strain. While possibly indicating strategic portfolio optimization toward an asset-light model, the abrupt shift raises concerns about financial distress driving reactive asset sales rather than strategic repositioning. Capital recycling appears to be fundamentally linked to addressing the structural OCF crisis identified previously.
The net financing outflow of SAR 16.23 million in FY2021 to aggressive external capital mobilization in subsequent years. This shift culminated in substantial net inflows: SAR 39.57 million (FY2022), SAR 105.68 million (FY2023 - representing a 167% YoY surge), and SAR 77.83 million (FY2024). This three-year capital raising pattern demonstrates strategic reliance on fund expansion. The sustained financing inflows directly offset severe operating cash flow deficits, creating a structural funding gap. The uninterrupted external funding requirement presents material refinancing and cost-of-capital risks should market conditions deteriorate.
The company exhibits a critical free cash flow (FCF) deterioration, transitioning from a healthy SAR 75.12 million generation (FY2021) to deeply negative territory: SAR -40.43 million (FY2022), SAR -97.86 million (FY2023), and SAR -82.75 million (FY2024). This sustained negative FCF profile—reflecting a -7.7% FCF yield in FY2024—signals fundamental cash consumption equivalent to 7.7% of revenue, rendering traditional DCF valuation problematic and raising existential concerns about business model sustainability.
Despite cumulative external financing exceeding SAR 220 million from FY2022- 2024, cash balances declined 25.9% over FY2021- 2023 due to severe operational cash burn. The FY2024 cash recovery to SAR 100.43 million (+95% YoY) was primarily driven by asset monetization activities and continued financing inflows rather than operational improvement. With an estimated quarterly cash burn of ~SAR 21 million, the current liquidity position provides approximately five quarters of runway.
Key Operational Risks
Investors need to carefully consider the following substantial risks when evaluating the prospects of 2P companies:
High concentration of government customers: 88.7% of the company's revenue comes from government customers. This extreme dependence brings significant risks: fluctuations in government budget cycles may lead to project delays or cancellations; extended payment cycles will affect the company's cash flow; changes in policy priorities may suddenly change the direction of IT investment. The Saudi government is promoting fiscal rationalization reforms and may implement stricter cost controls on IT service procurement.
Free cash flow continues to be negative. If this situation continues, it will limit its investment capacity and dividend payment space. If the company cannot alleviate cash flow pressure through operational efficiency improvements or financing means, it may be forced to cut strategic investments or dilute equity financing.
Risk of intensified market competition: The Saudi ICT market is attracting strong entry from international technology giants (such as IBM, Cisco) and regional competitors (such as stc solutions, NourNet). These competitors often have stronger capital strength and global technical resources, and may put pressure on 2P in bidding for large projects. In particular, as Saudi Arabia opens up more industries for foreign investment, the local presence of international system integrators will continue to increase.
Conclusion:
Despite trading at a discount to sector peers (20.4x forward P/E; 3.0x EV/Sales), due to has structural operational weaknesses and deteriorating fundamentals. The company faces an existential cash flow crisis, with operating cash flow turning persistently negative (-SAR 63.6M FY2024) after generating SAR 96.9M in FY2021, compounded by three consecutive years of negative free cash flow (-SAR 73.7M avg.). Severe working capital inefficiency is evidenced by a 232% surge in current assets alongside declining asset turnover (1.31x → 0.75x), reflecting unsustainable capital allocation. Revenue momentum has declined negatively (-5.2% YoY FY2024 to SAR 1.07B) despite Saudi Arabia's supportive ICT backdrop, signaling potential competitive erosion or demand softness, heightened by 88.7% reliance on volatile government contracts. While operational flexibility (15.8% margins; +480bps gross margin recovery) offers modest leverage potential, liquidity constraints (5-quarter cash runway at current burn rates) and refinancing risks (SAR 220 M+ raised FY2022- 24) overshadow valuation appeal. Intensifying competition from scaled global/regional players further threatens its mid-tier position.
Disclaimer:
Sahm is subject to the supervision and control of the CMA, pursuant to its license no. 22251-25 issued by CMA.
The Information presented above is for information purposes only, which shall not be intended as and does not constitute an offer to sell or solicitation for an offer to buy any securities or financial instrument or any advice or recommendation with respect to such securities or other financial instruments or investments. When making a decision about your investments, you should seek the advice of a professional financial adviser and carefully consider whether such investments are suitable for you in light of your own experience, financial position and investment objectives. The firm and its analysts do not have any material interests or conflicts of interest in any companies mentioned in this report.
Performance data provided is accurate and sourced from reliable platforms, including Argaam, Markwideresearch.
IN NO EVENT SHALL SAHM CAPITAL FINANCIAL COMPANY BE LIABLE FOR ANY DAMAGES, LOSSES OR LIABILITIES INCLUDING WITHOUT LIMITATION, DIRECT OR INDIRECT, SPECIAL, INCIDENTAL, CONSEQUENTIAL DAMAGES, LOSSES OR LIABILITIES, IN CONNECTION WITH YOUR RELIANCE ON OR USE OR INABILITY TO USE THE INFORMATION PRESENTED ABOVE, EVEN IF YOU ADVISE US OF THE POSSIBILITY OF SUCH DAMAGES, LOSSES OR EXPENSES.