
Saudi Market
TASI Technical Analysis:
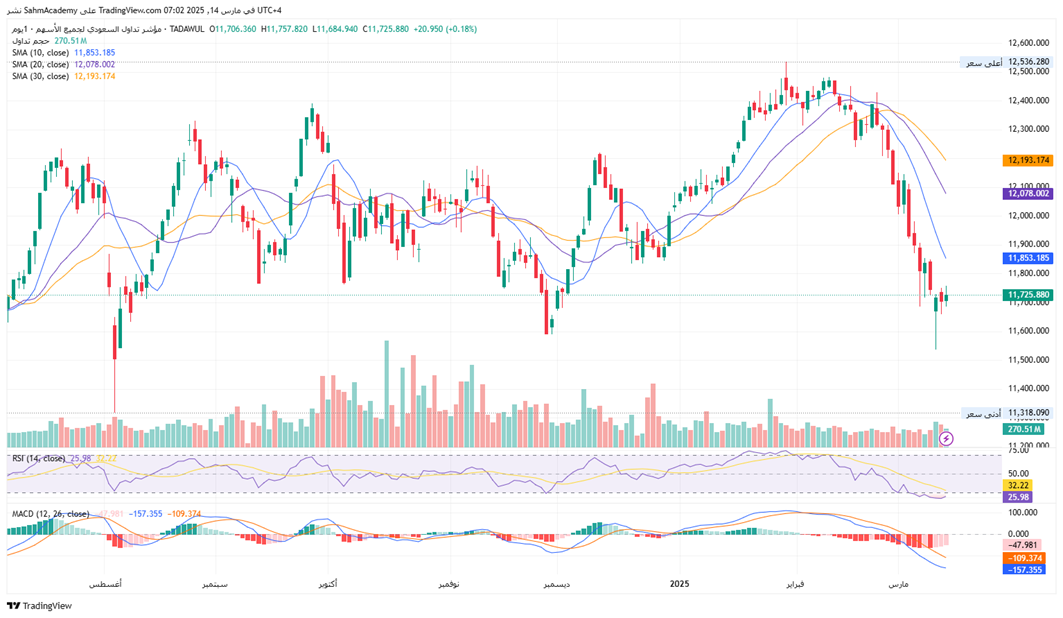
The TASI index has seen a significant correction of over 800 points (roughly 6.5%) from its recent peak of approximately 12,536.280, trading at around 11,725.880 as of now. The three key moving averages (SMA 10, SMA 20, SMA 30) show a clear bearish alignment, all trending downward and arranged in descending order. The price is currently below all these moving averages, confirming the broader downtrend. The RSI reading of 25.98 indicates an oversold market, which often precedes a potential bounce or recovery, though it's important to note that markets can remain oversold for extended periods during strong downtrends. The MACD indicator shows deeply negative values, with both lines below zero indicating bearish momentum, but the MACD line above the signal line could potentially signal weakening downside momentum. The volume bars show relatively consistent trading activity, with a slight increase in volume during the most recent decline.
TASI Index Weekly Market Summary (March 9 to March 13)
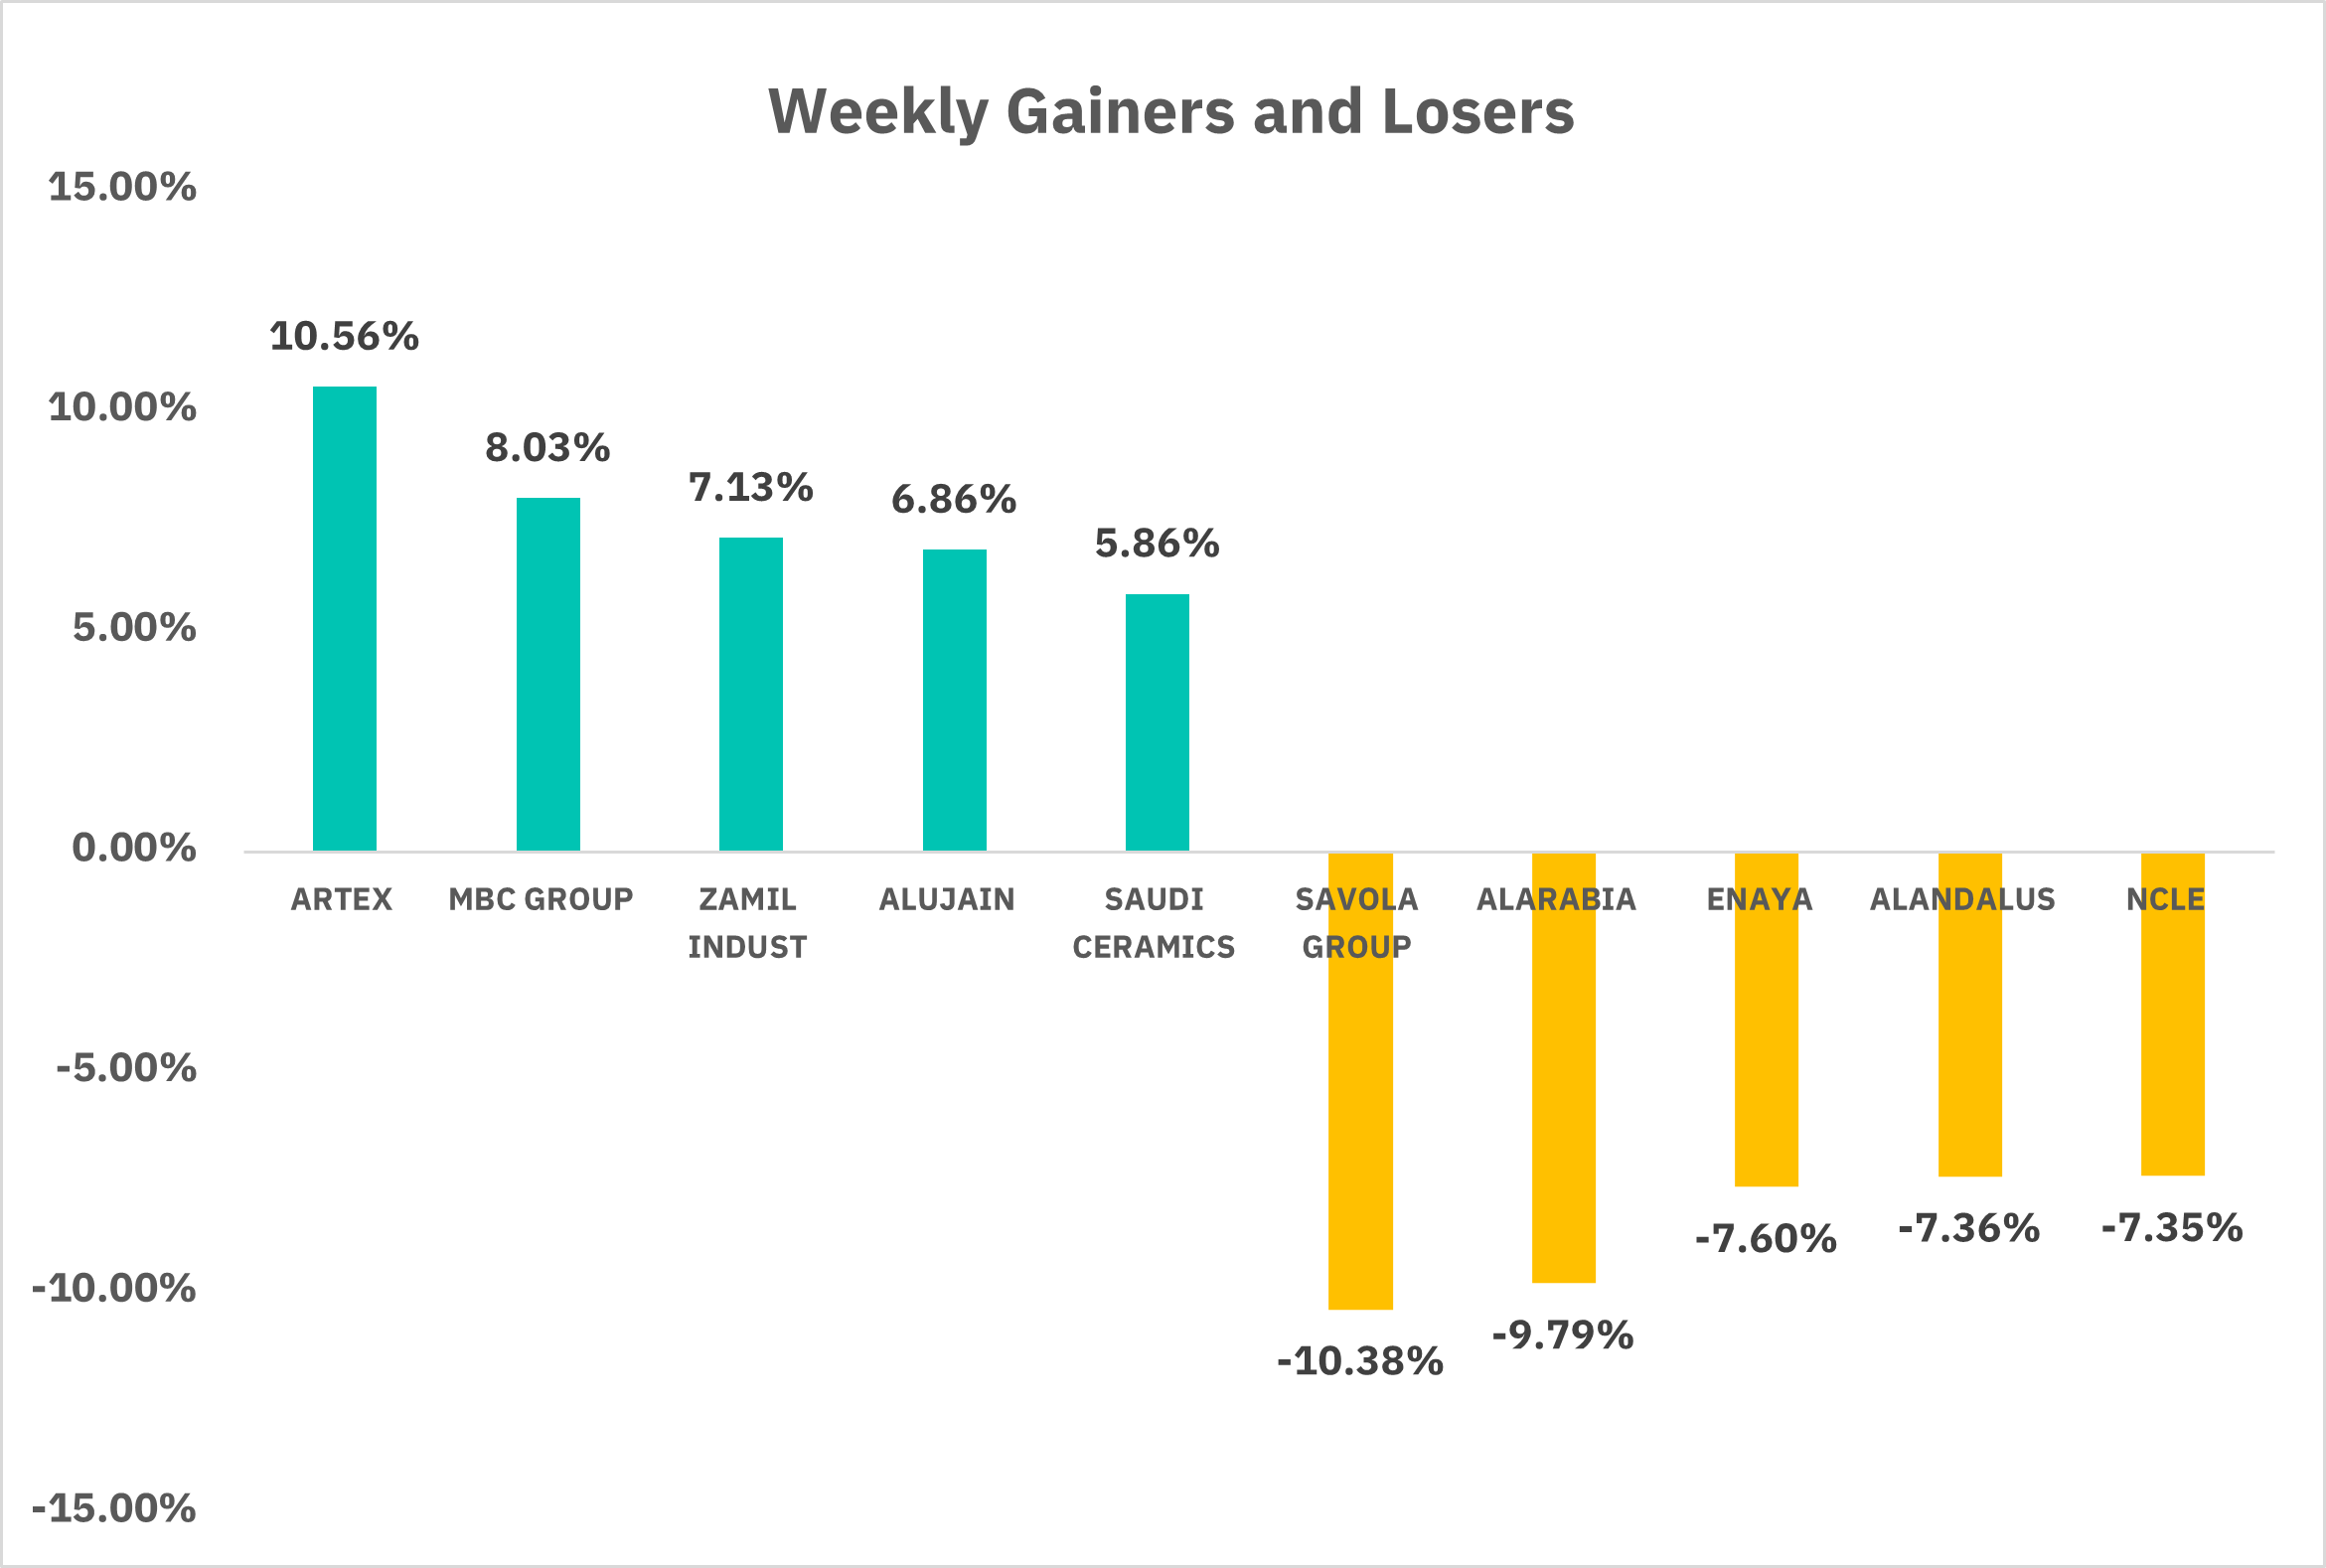
The overall performance of the Saudi market was relatively flat in the past week, with slight fluctuations in the market index. On March 13, the Saudi Stock Exchange All-Share Index closed up 0.18% at 11,725.88 points, but fell 0.93% this week. 116 stocks rose, led by ARTEX and MBC GROUP, up 10.56% and 8.03%. While 218 stocks fell, with SAVOLA GROUP and ALARABIA, down 10.38% and 9.79%. Investors should pay close attention to market developments in the coming week, especially the performance of large companies such as Saudi Aramco and the trend of international oil prices, as these factors may have an important impact on the overall trend of the Saudi market.
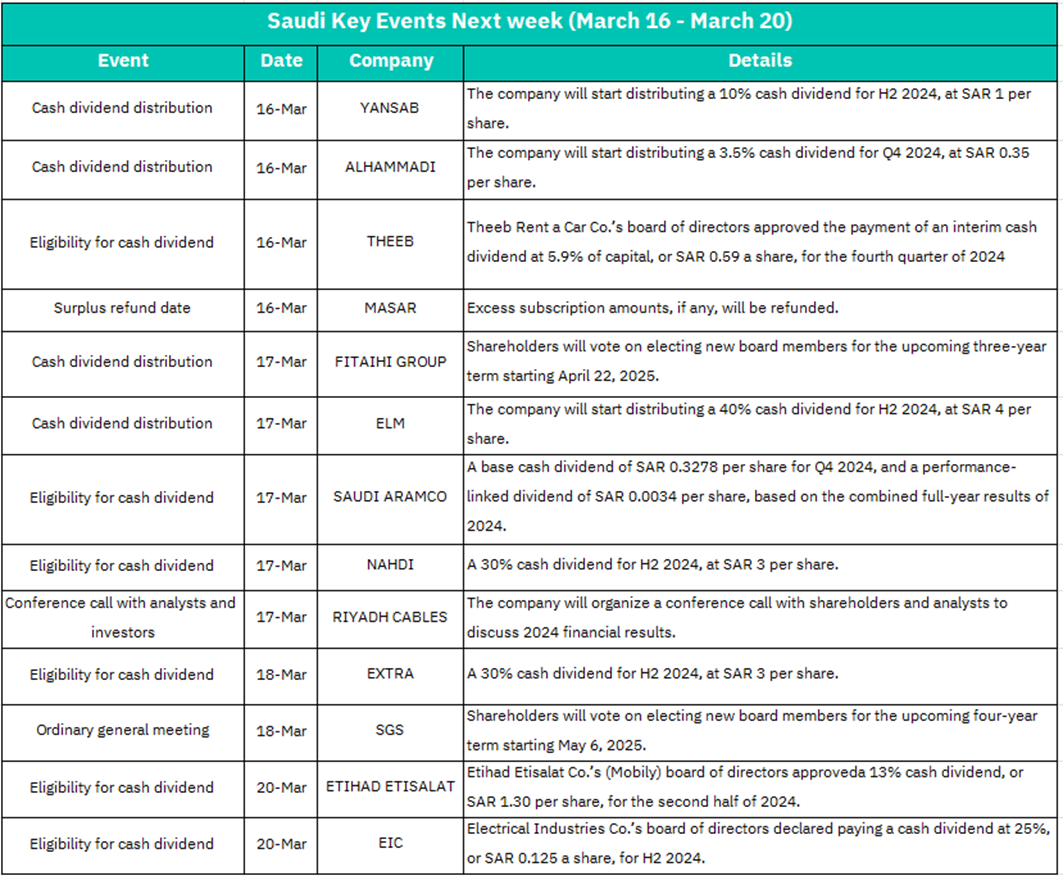
1. March 16: -Dividend Distribution by YANSAB and ALHAMMADI
YANSAB: Declaration of 10% cash dividend (SAR 1 per share) for H2 2024.
ALHAMMADI: Declaration of 3.5% cash dividend (SAR 0.35 per share) for Q4 2024.
High dividend ratio may attract short-term investors, providing share price support. However, if future investment capacity is constrained after dividend payout, long-term pressure should be monitored.
-THEEB Dividend Eligibility Confirmation
Declaration of 5.9% dividend (SAR 0.59 per share) for Q4 2024.
Before eligibility confirmation, "rights grabbing" trading (short-term price increase) may occur. After dividend distribution, some investors may take profits, so selling pressure should be watched.
-MASAR Excess Subscription Fund Refund
Refund of excess subscription funds.
2. March 17:-FITAIHI GROUP Annual General Meeting
Election of New Board Members: The new board members will serve until 2025.
The new board's strategic direction may influence the company's long-term development. Meanwhile, short-term stock price fluctuations may depend on the market's expectations regarding the management change.
-Dividend Distribution by ELM, SAUDI ARAMCO, and NAHDI
ELM: Declaration of a high 40% dividend (SAR 4 per share) for H2 2024, significantly above the market average.
SAUDI ARAMCO: Declaration of Q4 2024 basic dividend (SAR 0.3278 per share) and performance dividend (SAR 0.0034 per share).
NAHDI: Declaration of a 30% dividend (SAR 3 per share) for H2 2024.
ELM's high dividend may draw market attention and potentially boost the stock price in the short term, but its ability to sustain dividends needs to be assessed.
As a key stock, Saudi Aramco's stable dividends may enhance market confidence and attract long-term capital inflows.
-RIYADH CABLES Conference Call
Discussion of 2024 Financial Performance,if the performance exceeds expectations or positive signals are released, the stock price may rise; otherwise, it may face correction risks.
3. March 18: -EXTRA Dividend Eligibility Confirmation
Declaration of a 30% dividend (SAR 3 per share) for H2 2024. Similar to THEEB, rights grabbing trading may drive up the stock price, but a short-term pullback may follow the dividend distribution.
-SGS Annual General Meeting
Election of New Board Members: The new board members will serve until 2025.
If the new board introduces innovative strategies (such as business expansion), it may boost investor confidence.
4. March 20: -ETHIAD ETISALAT (Mobily) and EIC Dividend Eligibility Confirmation
Mobily: Declaration of a 13% dividend (SAR 1.3 per share) for H2 2024.
EIC: Declaration of a 25% dividend (SAR 0.125 per share) for H2 2024.
Mobily's relatively high dividend ratio may attract short-term capital inflows.
EIC's low absolute dividend amount may result in a muted market reaction.
U.S. Market
S&P500 Technical Analysis:
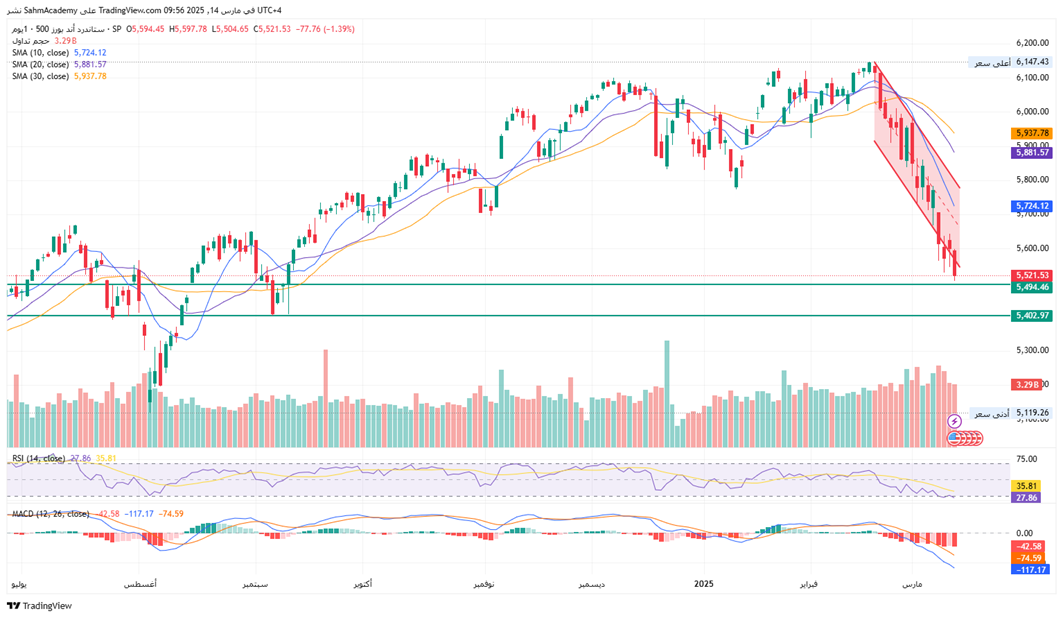
The S&P 500, currently around 5,521.53 points, has seen a significant correction of about 10.2% from its peak of approximately 6,147.43 points, entering bearish territory with a clear downward channel. The price action shows accelerated selling pressure with predominantly red candles, indicating strong bearish momentum. All three major moving averages (SMA 10, SMA 20, SMA 30) are aligned bearishly, confirming the downtrend. The RSI (14) is at 27.86, indicating oversold conditions but no bullish divergence yet. The MACD shows deeply negative values, though the histogram may be forming slightly higher lows. Increased selling volume during the decline confirms the bearish trend. The primary trend remains strongly bearish, with the next target being the 5,494 support level. While a short-term bounce could occur due to oversold conditions, a genuine reversal would require breaking above the downward channel and the 10-day SMA with strong volume, along with RSI moving back above 40 and a positive MACD crossover.
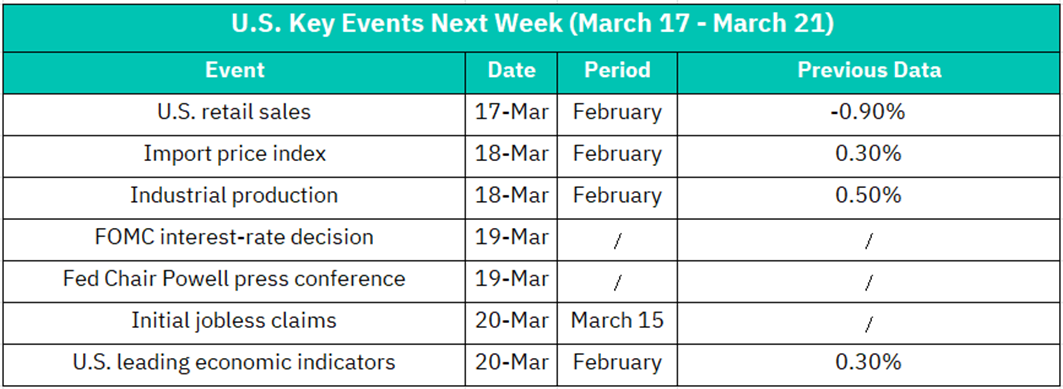
1. March 17 – U.S. February Retail Sales Data
Previous Value: -0.90%
Retail sales are a key indicator of consumer spending. If the data shows improvement (such as a narrower decline or a positive turn), it may ease recession worries, boost consumer-related stocks (like retail and catering), and lift the broader market.
If the data remains weak, it could increase expectations of a Federal Reserve rate cut, but may also dampen market risk appetite, pressuring high - valuation sectors like tech.
2. March 18 – February Import Price Index
Previous Value: +0.30%
A rise in import prices may aggravate inflationary pressures, reinforce the Fed's high - interest - rate stance, and negatively impact rate - sensitive sectors (like real estate and utilities).
If the data comes in below expectations, it may ease inflation concerns, potentially allowing tech and growth stocks to rebound.
-February Industrial Production Data
Previous Value: +0.50%
Growth in industrial production signals an expansion in manufacturing activities, which is positive for industrial and materials sectors (such as Caterpillar and 3M).
If the data misses expectations, it may weigh on cyclical stocks. However, if accompanied by cooling inflation, the market might shift towards pricing in rate cuts.
3. March 19 – FOMC Interest Rate Decision and Powell's Press Conference
Interest Rate Decision: The market expects the rate to remain unchanged at 5.25%-5.50%. Watch for any adjustments in the dot plot regarding the year's rate cut path.
Powell's Stance: A "dovish" signal (e.g., a clear rate cut timeline) could trigger a significant stock rally, especially in tech. Emphasis on inflation persistence might lead to market sell-off.
The FOMC meeting is this week's major risk event. Expect heightened market volatility (VIX index spikes). Investors should brace for short-term turbulence.
Bank stocks (like JPMorgan Chase) are rate - sensitive. Higher rate cut expectations may pressure them. Conversely, sustained high rates could boost net interest margins, supporting bank stock prices.
4. March 20 – Weekly Initial Jobless Claims
Previous Value: 209,000
If there is an increase in the number of initial jobless claims (e.g., exceeding 220,000), it may signal a loosening in the labor market, strengthen the case for rate cuts, and benefit growth stocks while weighing on the US dollar.
If the data remains low, it could support the Fed's "higher for longer" stance, potentially pressuring the stock market in the short term but supporting value stocks.
–February Leading Economic Index (LEI)
Previous Value: +0.30%
The LEI reflects the economic outlook for the next 6 - 12 months. A negative turn in the data could reinforce recession expectations, benefiting safe - haven assets (like gold and government bonds) while pressuring the stock market.
If the LEI remains stable or improves, it could ease market concerns and lift risk appetite.
Crypto ETF Technical Analysis:
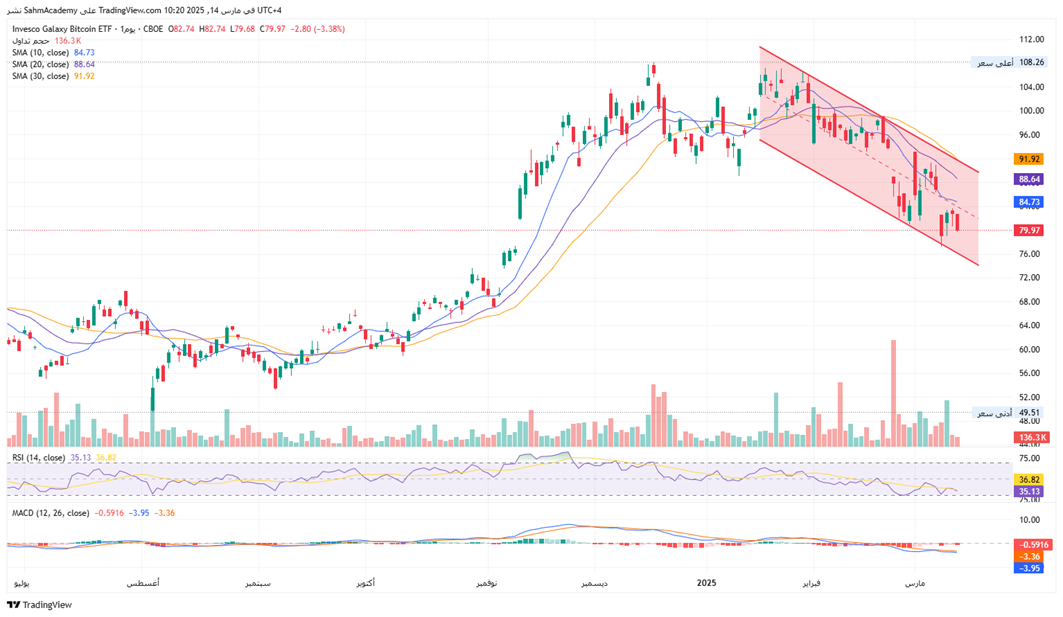
BTCO having corrected approximately 26% from its peak of 108.26 to its current level around 79.97. The price action shows a series of lower highs and lower lows since late January/early February 2025, with the asset attempting to stabilize near the 80 level but still within the bearish channel. All three key moving averages (SMA 10, SMA 20, SMA 30) are aligned bearishly, confirming the downtrend, and the RSI (14) reading of 35.13 indicates the asset is approaching oversold territory. The MACD shows negative values but with a potential slight bullish divergence forming. The most significant level to watch is the lower boundary of the channel around 76-78; a break below could accelerate the decline, while holding this support could lead to a bounce toward the upper channel boundary.
Disclaimer:
Sahm is subject to the supervision and control of the CMA, pursuant to its license no. 22251-25 issued by CMA.
The Information presented above is for information purposes only, which shall not be intended as and does not constitute an offer to sell or solicitation for an offer to buy any securities or financial instrument or any advice or recommendation with respect to such securities or other financial instruments or investments. When making a decision about your investments, you should seek the advice of a professional financial adviser and carefully consider whether such investments are suitable for you in light of your own experience, financial position and investment objectives. The firm and its analysts do not have any material interests or conflicts of interest in any companies mentioned in this report.
Performance data provided is accurate and sourced from reliable platforms, including Argaam, TradingView, MarketWatch.
IN NO EVENT SHALL SAHM CAPITAL FINANCIAL COMPANY BE LIABLE FOR ANY DAMAGES, LOSSES OR LIABILITIES INCLUDING WITHOUT LIMITATION, DIRECT OR INDIRECT, SPECIAL, INCIDENTAL, CONSEQUENTIAL DAMAGES, LOSSES OR LIABILITIES, IN CONNECTION WITH YOUR RELIANCE ON OR USE OR INABILITY TO USE THE INFORMATION PRESENTED ABOVE, EVEN IF YOU ADVISE US OF THE POSSIBILITY OF SUCH DAMAGES, LOSSES OR EXPENSES.
