We Value Your Feedback! Help us shape better content and experiences by participating in our survey. Join the Survey Now!
Saudi Market
TASI Technical Analysis:
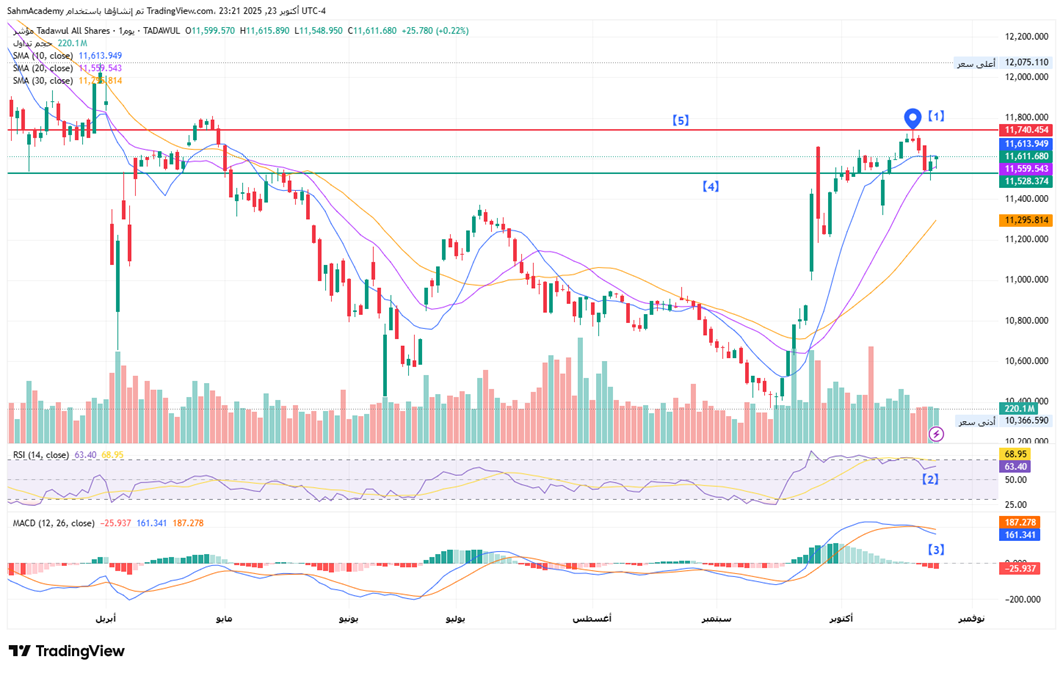
The TADAWUL All Shares Index is currently trading at 11,611.68, showing signs of consolidation after a powerful recovery rally from the September lows near 10,366. The index has successfully reclaimed the psychologically significant 11,600 level, which has served as a critical pivot point throughout 2025. However, the moving average structure reveals a complex technical picture with price trading above the SMA 10 (11,613.95) but below the SMA 20 (11,559.54) and SMA 30 (11,295.11), indicating short-term momentum remains positive while the intermediate trend structure is still normalizing after the sharp V-shaped recovery.
[1] The recent price action shows a series of long upper wicks near the 11,700-11,800 resistance zone, suggesting seller presence and distribution pressure at higher levels. Volume has been declining during this consolidation phase, which is typical behavior but raises concerns about the sustainability of further upside without fresh catalysts.
[2] From a momentum perspective, the RSI at 63.40 sits in neutral-to-bullish territory, having pulled back from overbought conditions above 70 seen during the initial October breakout. This reset provides technical room for another leg higher, though the indicator has yet to confirm renewed buying conviction.
[3] The MACD presents a concerning divergence with the histogram at -25.94 remains negative and expanding, indicating momentum is deteriorating despite price holding near recent highs. This bearish MACD configuration suggests the recent rally may be losing steam and warns of potential downside risk if support levels fail.
[4] Key support levels are identified at 11,528.
[5] Immediate resistance stands at 11,740 (double-top zone).
The technical outlook has turned neutral-to-cautious following the failed breakout attempt above 11,700, with the index now trapped in a 11,400-11,700 range. A decisive break below 11,400 would likely trigger a deeper correction toward 11,000-11,100, while a sustained move above 11,800 on expanding volume would validate the bullish case and open the path toward 12,000+. Given the negative MACD divergence and weakening momentum, traders should exercise caution and wait for clearer directional signals before committing significant capital, as the market appears to be in a distribution phase rather than accumulation.
TASI Index Weekly Market Summary (October 19 to October 24)
The TASI index decreased by 0.68%. With a trading week of 5 days, the total trading volume reached 24 billion Saudi Riyals, averaging 4.9 billion per day.
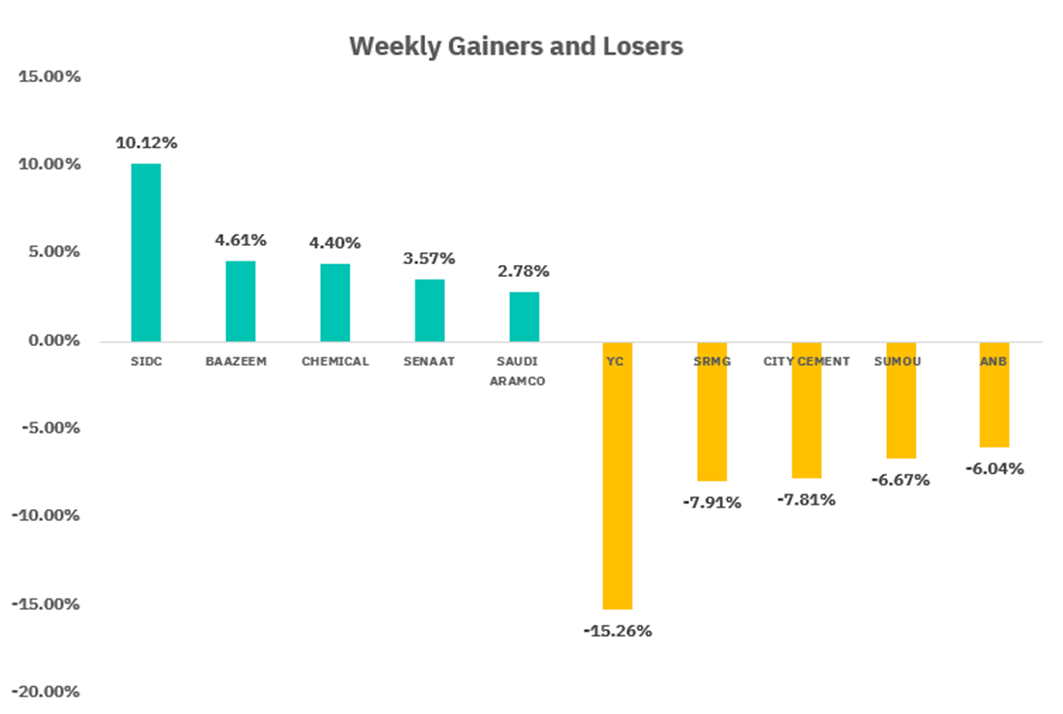
From the perspective of individual stock performance, 52 companies saw their stock prices rise this week, while 224 companies saw their stock prices fall. The companies with the highest increase included SIDC, BAAZEEM, CHEMICAL, with increases of 10.12%, 4.61%, and 4.40% respectively. The companies with the highest decline included YC, SRMG, CITY CEMENT with declines of 15.26%, 7.91%, and 7.81% respectively.
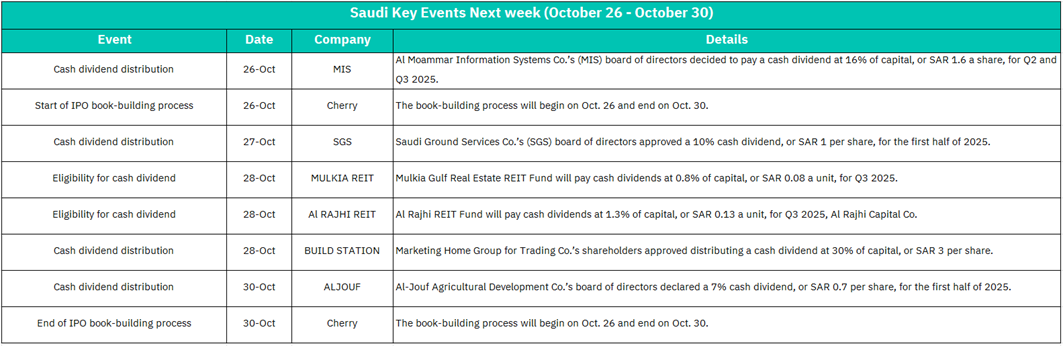
October 26:
MIS - Distribution of 16% cash dividend at SAR 1.6 per share for Q2 and Q3 2025
CHERRY - Start of IPO book-building process (October 26 - October 30)
Market Impact:
Al Moammar Information Systems Co.'s robust 16% dividend distribution demonstrates strong profitability and cash generation, which is positive for dividend-seeking investors and could support MIS stock price ahead of payment. However, the more significant event is Cherry's IPO book-building commencement, which marks a major capital markets activity. The IPO process will likely attract investor attention and capital allocation toward the new listing opportunity. This could create modest market rotation as investors assess Cherry's valuation and growth prospects relative to existing listed companies. The combined effect should provide moderate support to overall market sentiment, with Cherry's IPO creating incremental trading activity and liquidity in the broader market.
October 27:
SGS - Distribution of 10% cash dividend at SAR 1 per share for H1 2025
Market Impact: Saudi Ground Services Co.'s 10% first-half dividend distribution reflects solid operational performance and consistent cash flow generation. The dividend announcement reinforces investor confidence in the company's profitability and shareholder-friendly capital allocation policies. This could attract dividend-focused investors to accumulate positions ahead of the payment date, providing price support for SGS stock and contributing to positive market sentiment.
October 28:
MULKIA REIT - Eligibility for 0.8% cash dividend at SAR 0.08 per unit for Q3 2025
Al RAJHI REIT - Eligibility for 1.3% cash dividend at SAR 0.13 per unit for Q3 2025
BUILD STATION - Distribution of 30% cash dividend at SAR 3 per share
Market Impact: The REIT sector shows consistent income generation with both Mulkia Gulf Real Estate REIT Fund and Al Rajhi REIT Fund announcing Q3 dividend eligibility, providing stable income streams for yield-focused investors. While the REIT dividend yields are relatively modest, they demonstrate portfolio stability and consistent performance. However, the standout event is BUILD STATION's exceptional 30% dividend distribution at SAR 3 per share—one of the highest payout ratios on the market. This signals extraordinary profitability and shareholder-friendly capital allocation, likely to generate significant buying interest and strong price support. The combination of steady REIT dividends and BUILD STATION's exceptional payout should drive broad-based positive sentiment across the market, attracting both income investors and those seeking capital appreciation opportunities.
October 30:
ALJOUF - Distribution of 7% cash dividend at SAR 0.7 per share for H1 2025
CHERRY - End of IPO book-building process
Market Impact: Al-Jouf Agricultural Development Co.'s 7% first-half dividend distribution demonstrates healthy earnings and continues the week's theme of strong shareholder returns. More significantly, the conclusion of Cherry's IPO book-building process marks a critical milestone for the company's public listing. The final pricing and allocation details will be announced following the book-building closure, which could generate substantial market interest and trading activity. A successful IPO book-building process typically signals strong investor demand and market confidence in the new issuer. This concluding event provides positive closing momentum for the week and sets the stage for Cherry's potential trading debut in the near term, potentially attracting capital inflows and enhancing overall market liquidity.
U.S. Market
S&P500 Technical Analysis:
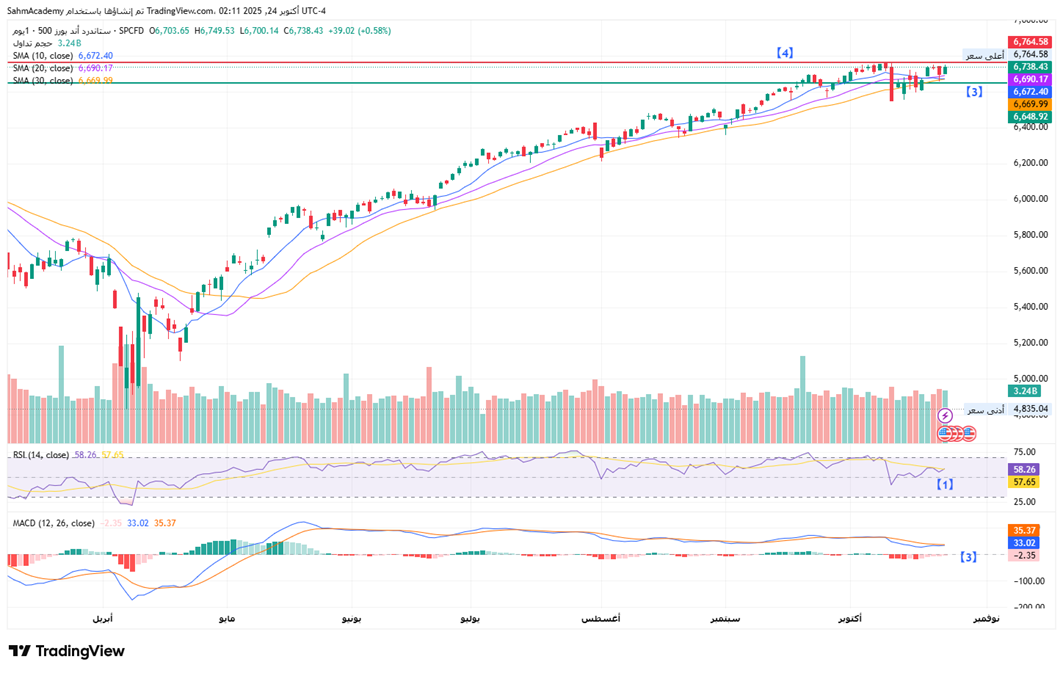
The S&P 500 is currently trading at 6,738.43, continuing to consolidate near all-time highs after establishing a peak at 6,764.58 in late October. The moving average structure remains impeccably bullish, with price trading above the SMA 10 (6,672.40), SMA 20 (6,690.17), and SMA 30 (6,669.99), all of which are positively sloped and properly aligned in a golden cross formation. This technical configuration has provided consistent support during minor pullbacks and confirms robust institutional accumulation. Recent price action shows a tightening range between 6,700-6,765, characterized by overlapping candlesticks with long upper and lower wicks, suggesting indecision and equilibrium between buyers and sellers at these elevated levels.
[1] From a momentum perspective, the RSI at 58.26 sits comfortably in neutral territory, having reset from the overbought conditions seen during the October breakout attempt above 6,700. This healthy pullback in momentum provides technical room for another push toward new highs without immediate exhaustion concerns.
[2] The MACD (12, 26) presents a constructive but cautious setup with the histogram at -2.35 remains slightly negative, indicating momentum has decelerated even though the overall trend remains positive. This divergence is common during consolidation phases near record highs and doesn't necessarily signal a reversal, but rather suggests the market needs a catalyst to break out of the current range.
[3] Key support levels are identified at 6,648.
[4] Immediate resistance stands at the all-time high of 6,765.
The technical outlook remains constructive with no major distribution signals, broken support levels, or bearish patterns. The tight consolidation near record highs, combined with neutral momentum readings, suggests the index is building energy for the next directional move. A breakout above 6,765 on expanding volume would likely target 6,800-6,850, while a breakdown below 6,648 could trigger a healthy correction toward 6,500. Given the strength of the underlying trend and absence of negative divergences, the path of least resistance continues to favor the upside, though patience may be required as the market digests recent gains.
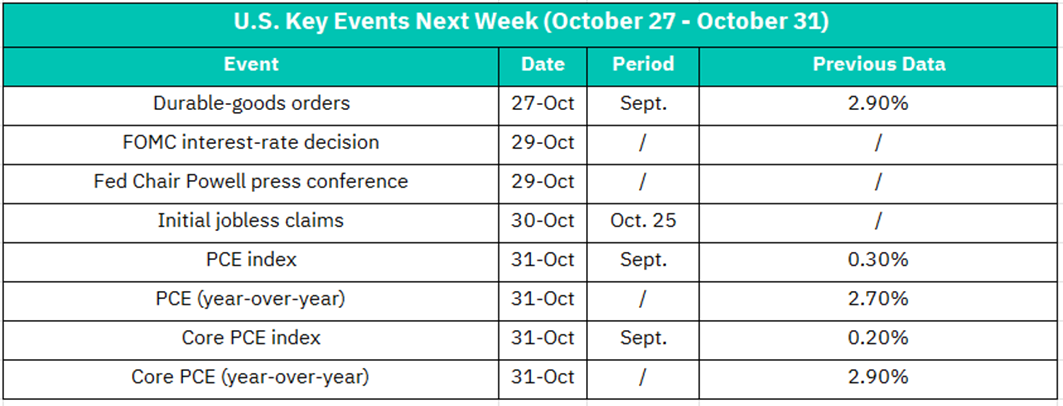
October 27:
Durable-goods orders - Sept. Period | Previous Data: 2.90%
Market Impact: Durable-goods orders data provides insight into business investment and manufacturing sector health. A reading above 2.90% would signal strengthening capital expenditure and industrial demand, supporting cyclical stocks and the broader equity market while boosting confidence in economic resilience. Conversely, a decline below 2.90% could indicate weakening business investment and manufacturing slowdown, potentially pressuring industrials, technology, and growth-oriented sectors. The market typically responds with moderate volatility, affecting sector rotation between defensive and economically-sensitive equities. This data is particularly important for assessing corporate confidence and potential future GDP growth trajectory.
October 29:
FOMC interest-rate decision
Fed Chair Powell press conference
Market Impact: This is the most significant event of the week with broad market implications. The Federal Reserve's interest-rate decision will be the cornerstone of market sentiment, determining whether rates remain unchanged, increase, or decrease. A hawkish stance (rate hold or increase) would likely pressure equities, particularly growth and technology stocks sensitive to higher discount rates, while supporting the U.S. Dollar and Treasury yields. A dovish stance (rate cut or guidance for future cuts) would typically support equity valuations, especially growth stocks, lower Treasury yields, and weaken the Dollar. Fed Chair Powell's press conference following the decision is equally crucial, as his commentary on inflation trajectory, economic outlook, and future policy direction will heavily influence market reaction and forward guidance expectations. Expect significant volatility across all asset classes—equities, bonds, currencies, and commodities—during and immediately following the announcement and press conference. This single event could dominate market direction for weeks ahead.
October 30:
Initial jobless claims - Oct. 25 Period
Market Impact: Initial jobless claims provide real-time insight into labor market health and employment trends. A lower-than-expected reading would reinforce labor market strength, supporting equity valuations and potentially bolstering Fed confidence in the economic expansion, which could limit rate-cut expectations. A higher-than-expected reading would signal labor market weakness and economic softening, potentially triggering risk-off sentiment and renewed expectations for future rate cuts, benefiting bonds and defensive sectors. The market typically responds with moderate volatility focused on equity sectors, Treasury yields, and currency movements. This data is particularly important for validating or challenging the Fed's economic assumptions just one day after the policy decision.
October 31:
PCE index - Sept. Period | Previous Data: 0.30%
PCE (year-over-year) - Previous Data: 2.70%
Core PCE index - Sept. Period | Previous Data: 0.20%
Core PCE (year-over-year) - Previous Data: 2.90%
Market Impact: Friday features the most comprehensive inflation data release of the week, with critical implications for post-FOMC decision policy expectations. These PCE metrics are the Fed's preferred inflation measures and will significantly impact market interpretation of the Fed's rate decision from Wednesday. If PCE readings come in higher than expected across the board, it would validate hawkish Fed positioning and could pressure equities, particularly growth stocks, while pushing Treasury yields higher. Conversely, if readings come in lower than expected, it would support dovish Fed narrative and could drive equity rallies, lower yields, and boost market confidence in disinflation progress. The Core PCE data is especially important as it excludes volatile food and energy prices and directly influences Fed policy decisions. A "hot" PCE report would signal sticky inflation concerns, while a "cool" report would suggest progress toward the Fed's 2% target. This Friday release will provide crucial market validation or invalidation of the Fed's Wednesday policy stance, potentially creating significant follow-through trading activity and sector rotation based on how the data compares to Fed expectations.
Crypto ETF Technical Analysis:
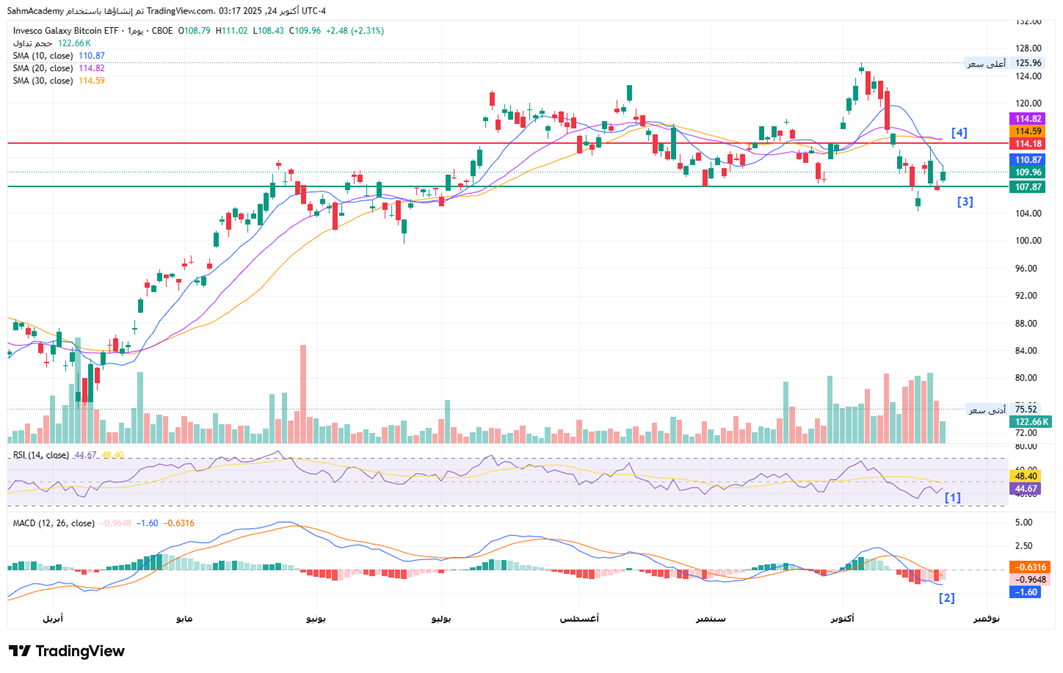
BTCO is currently trading at $109.96, the price action reveals a deteriorating technical structure, with the ETF trading below the SMA 10 ($110.87), SMA 20 ($114.82), and SMA 30 ($114.59), indicating a bearish moving average configuration where all key averages are negatively aligned. This death cross formation represents a significant shift from the previously constructive setup, confirming the breakdown of the uptrend.
[1] From a momentum perspective, the RSI at 44.67 has retreated sharply from overbought territory above 70 and now sits below the neutral 50 threshold, indicating the momentum has decisively shifted to bearish. The indicator is approaching the 40 level, which historically has provided temporary support before either stabilizing or continuing lower toward oversold conditions.
[2] The MACD (12, 26) presents an unambiguously bearish configuration with the histogram at -0.97 continues to expand negatively, confirming accelerating downside momentum.
[3] Key support levels are identified at $107.
[4] Immediate resistance now stands at $114.
Given the high correlation with Bitcoin's spot price, traders should closely monitor the cryptocurrency's price action, as weakness there would likely pressure the ETF further. The prudent strategy remains defensive until clear stabilization signals emerge, including a MACD crossover and RSI recovery above 50.
Disclaimer:
Sahm is subject to the supervision and control of the CMA, pursuant to its license no. 22251-25 issued by CMA.
The Information presented above is for information purposes only, which shall not be intended as and does not constitute an offer to sell or solicitation for an offer to buy any securities or financial instrument or any advice or recommendation with respect to such securities or other financial instruments or investments. When making a decision about your investments, you should seek the advice of a professional financial adviser and carefully consider whether such investments are suitable for you in light of your own experience, financial position and investment objectives. The firm and its analysts do not have any material interests or conflicts of interest in any companies mentioned in this report.
Performance data provided is accurate and sourced from reliable platforms, including Argaam, TradingView, MarketWatch.
IN NO EVENT SHALL SAHM CAPITAL FINANCIAL COMPANY BE LIABLE FOR ANY DAMAGES, LOSSES OR LIABILITIES INCLUDING WITHOUT LIMITATION, DIRECT OR INDIRECT, SPECIAL, INCIDENTAL, CONSEQUENTIAL DAMAGES, LOSSES OR LIABILITIES, IN CONNECTION WITH YOUR RELIANCE ON OR USE OR INABILITY TO USE THE INFORMATION PRESENTED ABOVE, EVEN IF YOU ADVISE US OF THE POSSIBILITY OF SUCH DAMAGES, LOSSES OR EXPENSES.