Catalog

NVIDIA (NVDA): The "Blackwell" Era Begins — Why the AI Bubble Myth is Shattered Amazon: The Awakening Giant Can End of U.S. Government Shutdown Push S&P 500 Past All-Time Highs Again? Cherry IPO: Is 13x P/E Fair Value for Saudi Arabia's Car Rental Market? Bull Market or Bull Trap? S&P 500 Eyes 7,000 as Key Economic Data Looms! Broadcom (AVGO): Building the Backbone of the AI Era S&P 500 at 6,738 Awaits Fed's Verdict - Breakout Imminent? Saudi Kayan: From Market Leader to Restructuring—Can It Navigate the Downturn? U.S. Stocks Consolidate While Saudi Momentum Accelerates - Could CPI Change Everything? Micron (MU): The AI Super-Cycle's Core Beneficiary S&P 500 Hits Record Highs at 6,764 - Thursday's PPI Could Ignite Next Move! Almajdiah: How a 107x Oversubscribed IPO Masks Deteriorating Fundamentals S&P 500 Hits Record Highs at 6,715 - FOMC Minutes Could Ignite Next Move? MicroStrategy: The Leveraged Bitcoin Play - Dissecting the Dual-Loop Model Behind a $100B Valuation S&P 500 Eyes 6,800 Target as Jobs Data Looms - Will Bulls Break Through? Build Station: How It Tripled Equity While Profits Collapsed in Saudi's $70B Boom S&P 500 Flashes 'Golden Signal' at 6,631; PCE Data Could Trigger Epic 7,000 Run? AppLovin (APP): Deconstructing the $160 Billion Valuation: A Proven King or an Overpriced Hope? TASI hits “death cross”; Fed meeting could trigger a flip—historic opportunity? Saudi Chemical: How It Achieved 23% Revenue CAGR Amid Industry Pressure S&P 500 Surges, TASI Struggles – What’s Ahead? Alphabet: A Giant at the AI Crossroads - The Disrupted King or a Re-Crowned Emperor? Market Divergence Extreme: S&P Soars to Records as Bitcoin ETF Targets $105 Sport Clubs Analysis: How This Saudi Fitness Chain Cracked the Code Bitcoin Double-Top Breakdown While S&P 500 Flashes Warning Signals NVIDIA: From Chip Maker to AI's Full-Stack Architect S&P Reaches New Peaks, TASI Signals Wedge Pattern ACWA Power Analysis: Saudi-Backed Energy Giant's $250B Global Expansion Strategy TASI Flashes Major Reversal — Is This the Turning Point? Microsoft (MSFT): Cornerstone of the AI Empire TASI Crisis Point Meets S&P 500 Euphoria - Which Way Will Markets Swing? Miahona Analysis: Free Cash Flow Rockets 2,430% in 3 Years - The Next Big Thing? TASI Crashes as S&P 500 & Crypto Go Parabolic - Fed Week Alert! Circle (NYSE: CRCL): Minting the Digital Dollar, Defining the Future of Finance S&P500 Crushes All MAs as TASI Forms Bearish Triangle - Major Shift Ahead? Flynas Analysis: Saudi Arabia's Aviation Goldmine or High-Risk Gamble? Saudi Recovery Ignites as US Stocks Crush All-Time Records - What's Next? Robotaxi: The AI-Powered Revolution Reshaping Our Cities and Minting the Next Trillion-Dollar Market Saudi Market Rebounds, S&P 500 at Highs: Will It Last? CENOMI RETAIL Analysis: Financial Meltdown Raises Red Flags for Investors TASI’s Rebound Pattern Revealed: Spotting the Next Key Move US Investment Strategy Outlook: H2 2025 TASI Critical Support Test —Next Trading Opportunity Revealed! UCIC Analysis: 106% Profit Leap Amid Market Slowdown—What’s Next? Big Moves Ahead-The Signal Smart Money Can’t Ignore Why Smart Money Is Quietly Positioning for TASI's Breakout Perfect Presentation(2P) Analysis: Discount Trap or Hidden Goldmine? Secret Signals Flash Red: Major Market Shift Incoming? S&P 500 Flag Pattern Reveals Shocking Truth. What Happens Next? Mouwasat: Navigating Challenges and Seizing Growth in Saudi Healthcare The Hidden Signal Behind Market's Surprising Recover Markets Diverge: The Hidden Pattern Behind Last Week's Moves MASAR's Mirage: The Billion-Riyal Paradox Awaits Investors Market Crossroads: Hidden Signals Reveal Coming Opportunities? Tesla Beyond Cars: A Strategic Analysis of the EV Giant's Transformation into a Multi-Vertical Tech Opportunity Unveiled: Navigating the Saudi Market Recovery ENTAJ Analysis: Saudi Poultry Leader or Valuation Bubble? Saudi Market Alerts: Is TASI Showing Signs of Bottoming Out? Saudi Market Rebounds: Has the Bearish Trend Reversed? Crisis or Opportunity? Navigating Trump's Tariff Impact with Strategic Moves 106% Profit Explosion: Rasan's Revolution Reshaping Saudi Finance TASI rises 2.82%, Trump's tariff policy in focus this week In-Depth Equity Analysis: XPeng Inc. (XPEV) Weekly Report on Saudi and U.S. Stock: Technical Breakthroughs of Key Indices ELM Analysis: Investment Opportunities Under Sound Financials Saudi & US Markets Face Technical Corrections as Fed Decision Looms In-Depth Equity Analysis: Alibaba Group Holdings Ltd ADR (BABA) Global Markets Under Pressure, Saudi & US Indices Show Bearish Trends Tamkeen: Cash-Rich Leader, High Dividend Risk Alert TASI and S&P 500 Drop Over 2% Amid Broader Selling Momentum U.S. Stock Market Q1 Investment Strategy TASI Tests Resistance; US Key Data Imminent Nice One: Undervalued Opportunity In Beauty Digital Market Weekly Compass: Presidents' Day Pause & Saudi's Capital Markets Forum Take Center TASI Hits Overbought Zone, LEAP 2025 Fuels Tech Trends Weekly Report (January 26 – January 30) Weekly Report (January 19 – January 23) In-Depth Equity Analysis: Uber Technologies, Inc. (UBER) Weekly Report (January 12 – January 16) Weekly Report (January 5 – January 9) In-Depth Equity Analysis: Broadcom Inc. (AVGO) Weekly Report (December 29 – January 2) Weekly Report (December 22 – December 26) In-Depth Equity Analysis: On Holdings (ONON.NYSE) Weekly Report (December 15 – December 19) The AI Smart Glasses Boom and Must-Watch Stocks Salesforce: Surfing the AI Growth Wave for Market Leadership Meta: Can AI Drive Growth Amid Profit Pressures? Alibaba: Attractive Valuation Amid Growth and Policy Shifts NIO: Navigating Through the EV Storm PDD's Growth Dilemma: Challenge or Breakthrough? SMCI Stock Drops: Time to Invest? Nvidia Stock Rollercoaster: What's Ahead? US AI Investment Inflection Point: As NVIDIA Peaks, Palantir Takes Flight

TASI rises 2.82%, Trump's tariff policy in focus this week

Saudi Market

TASI Technical Analysis:

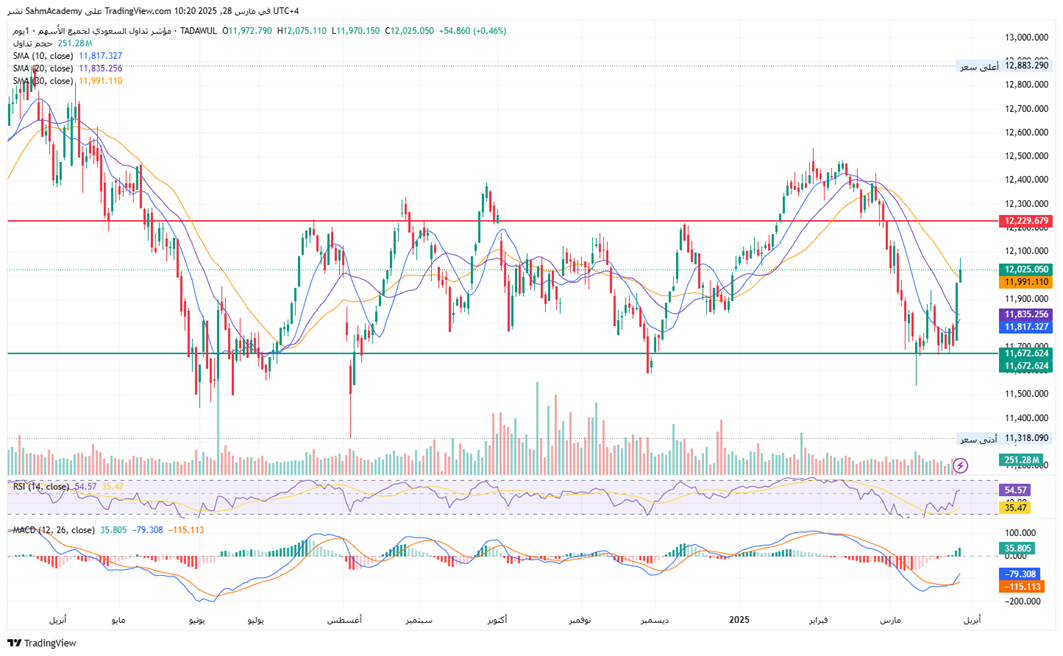
TASI is currently at 12,025.05 points with significant volatility. The RSI of 54.57 indicates a neutral market, neither overbought nor oversold. The MACD shows recent bullish momentum but hints at a potential trend reversal. Support is around the 11,672 points area, with resistance at 12,229 points. Short - term bullish signals are emerging, and an upward move could follow if the price breaks above resistance with increased volume. The relatively stable volume suggests sustained market interest. 

TASI Index Weekly Market Summary (March 23 to March 27)

Over the week of March 23 to March 27, 2025, the TASI (Tadawul All Share Index) rose by 2.82%, underpinned by an average daily turnover of SAR 4.92 billion and total transactions exceeding 24.2 billion. 
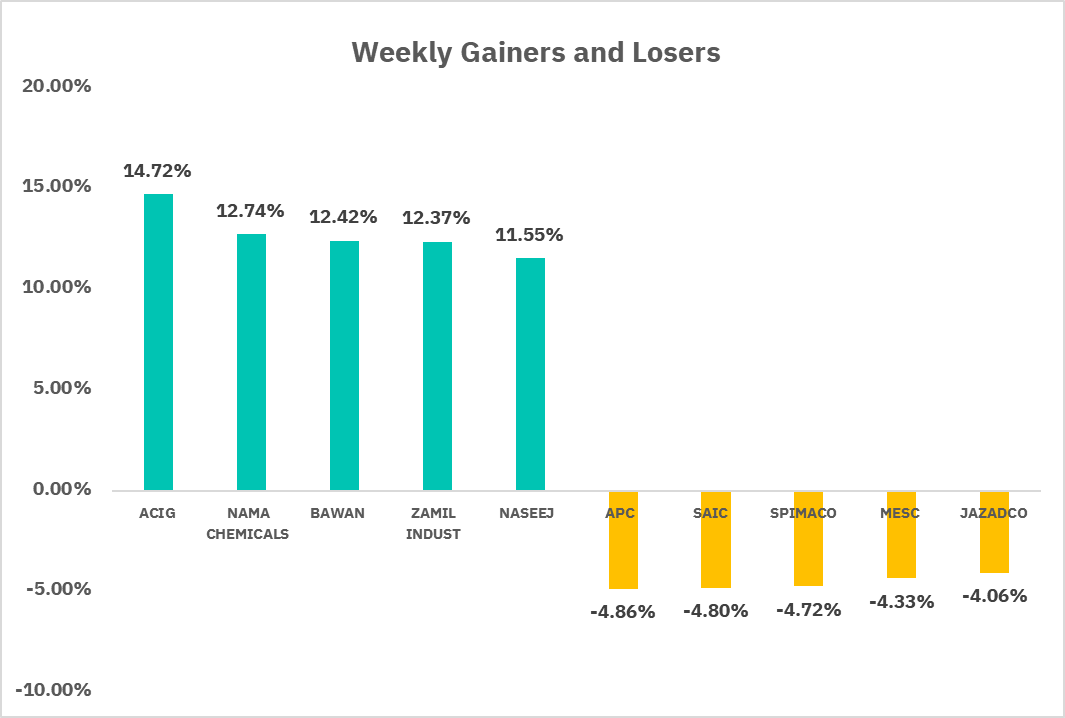
From the perspective of individual stock performance, 220 companies saw their stock prices rise this week, while 46 companies saw their stock prices fall. The companies with the highest increase included ACIG, NAMA CHEMICALS, BAWAN, with increases of 14.72%, 12.74%, and 12.42% respectively. The companies with the highest decline included APC, SAIC, SPIMACO, with declines of 4.86%, 4.80%, and 4.72% respectively.

U.S. Market

S&P500 Technical Analysis:

The market is currently at 5,693 points, showing a bearish trend but with potential signs of consolidation, having recently bounced off a significant support level around 5,494. Shorter - term SMAs are below longer - term ones, indicating bearishness but also potential trend reversal. The RSI is neutral at 44.26, suggesting neither overbought nor oversold conditions and possible trend change or sideways movement. The MACD shows recent bullish divergence and a potential short - term bullish momentum as its line crosses above the signal line, with the histogram indicating positive momentum.
Key support is at 5,507 points, with immediate resistance around 5,706-5,817. Trading volume is consistent, with recent spikes suggesting increased market interest and confirming price movement, indicating potential trend strength. 

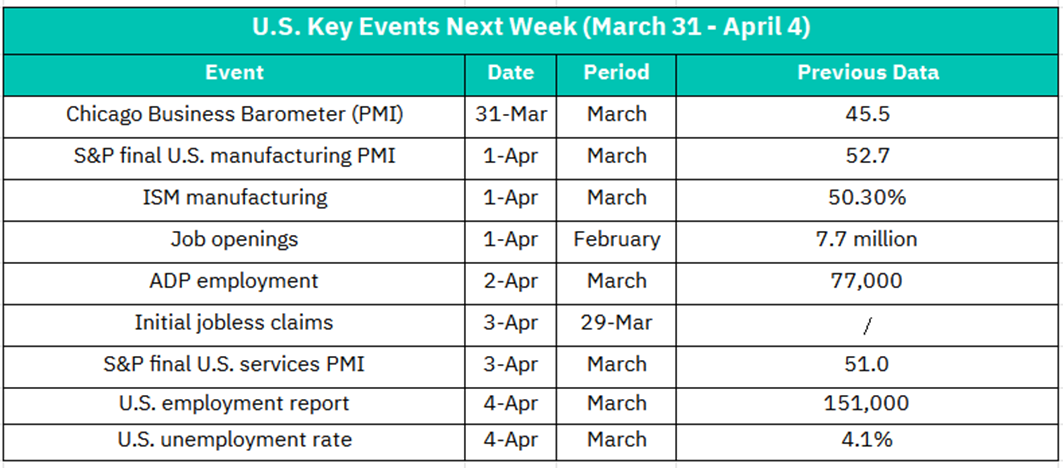
1. March 31–  Chicago Business Barometer (PMI)
Previous Data: 45.5 (contractionary level below 50).
A reading above 50 could signal regional economic expansion, boosting sentiment in cyclical sectors (e.g., industrials). A weaker figure may weigh on market confidence, especially in manufacturing-exposed stocks.

2. April 1 – S&P Final U.S. Manufacturing PMI
Previous Data: 52.7 
Confirmation of steady growth would support equities, particularly industrials and tech. A downward revision might trigger concerns about slowing factory activity.
–  ISM Manufacturing Index
Previous Data: 50.3% (barely expansionary).
A rise above 51% could lift markets, signaling resilience in manufacturing. A drop below 50% (contraction) may spook investors, pressuring cyclical stocks.
–  Job Openings (February)
Previous Data: 7.7 million.
Higher openings suggest labor market tightness, potentially stoking wage-inflation fears. This could dampen rate-cut hopes, weighing on growth stocks (e.g., tech) sensitive to borrowing costs.

3. April 2 – ADP Employment (March)
Previous Data: 77,000 (low due to seasonal factors).
A rebound to ~150K+ would align with Fed’s “soft landing” narrative, supporting equities. A weak print (<100K) might revive recession fears, hitting risk assets.

4. April 3 – Initial Jobless Claims (Week of March 29)
Persistent low claims (sub-220K) indicate labor strength, reinforcing confidence in consumer-driven sectors (e.g., retail). A spike could trigger volatility.
– S&P Final U.S. Services PMI
Previous Data: 51.0 (modest expansion).
Services dominate the U.S. economy; upward revisions could lift broad indices (S&P 500). A downgrade may raise growth concerns, hurting hospitality and financial stocks.

5. April 4 – U.S. Employment Report (Nonfarm Payrolls, March)
Previous Data: 151,000.
A strong print (>200K) could signal economic resilience but may delay Fed rate cuts, pressuring rate-sensitive sectors (real estate, utilities). A miss (<150K) might fuel rate-cut bets, boosting tech and small caps.
– Unemployment Rate (March)
Previous Data: 4.1%.
A stable or lower rate (≤4.1%) supports consumer confidence, benefiting discretionary stocks. A rise above 4.3% could spark recession worries, dragging down cyclicals.

Crypto ETF Technical Analysis:

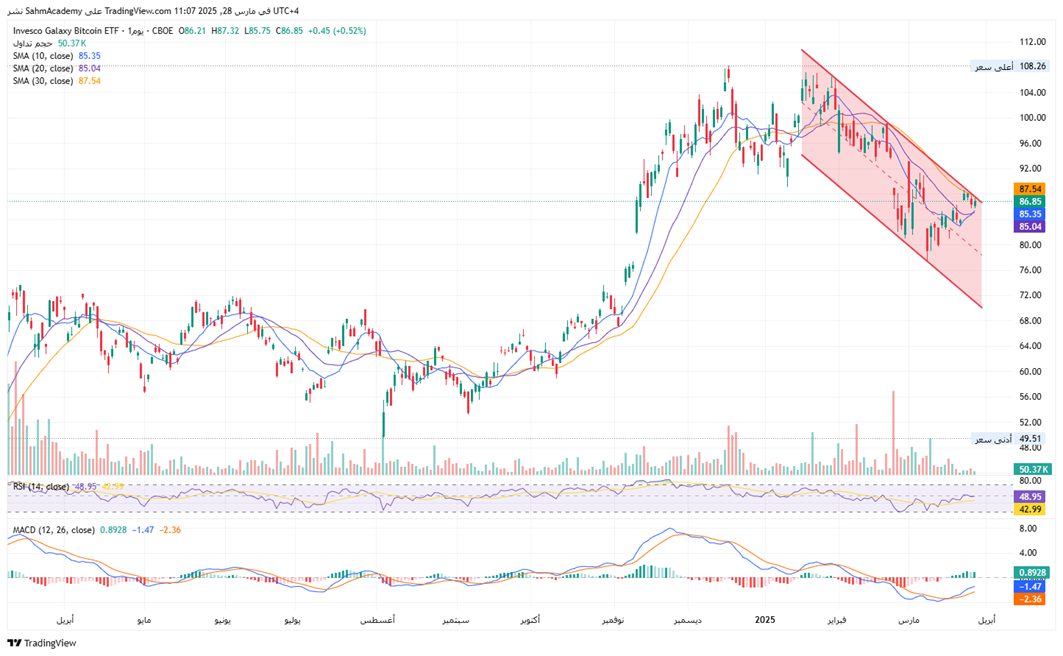
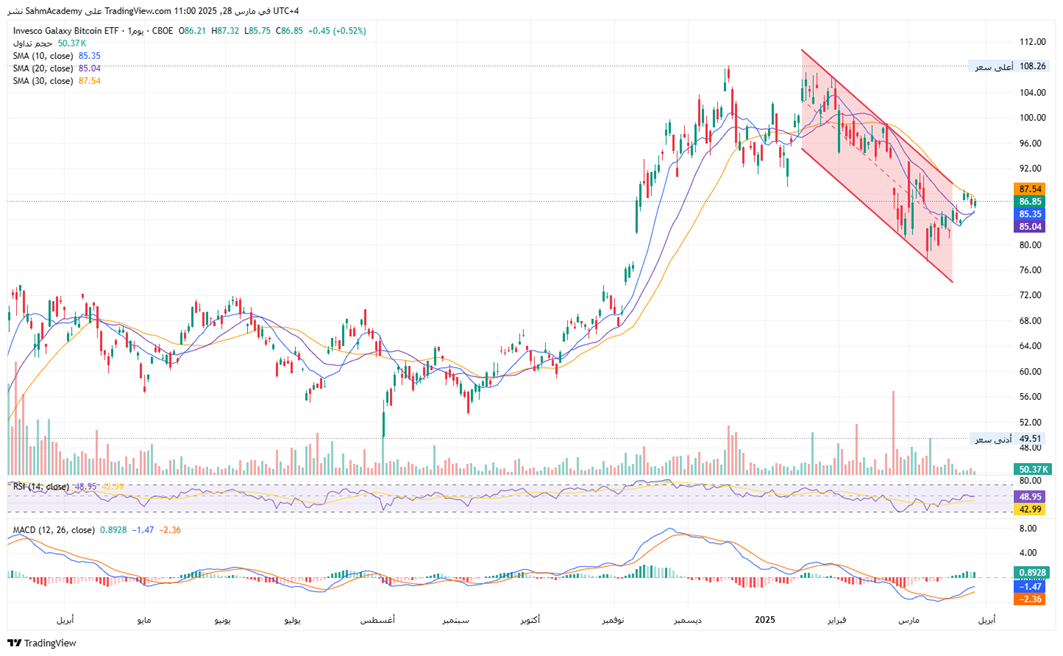
The Invesco Galaxy Bitcoin ETF is in a complex consolidation within a descending channel at $86.85. The 10 - day, 20 - day, and 30 - day SMAs suggest a neutral to slightly bullish short - term momentum, with converging moving averages hinting at a potential trend shift. The RSI of 48.95 signals neutral momentum with a slight bearish inclination but not oversold. The MACD shows early bullish divergence and a possible trend change.
Price is in a descending channel, consolidating between $80 - $90, with recent action indicating a potential breakout. For short - term traders, watch for a breakout above the $87 - $88 resistance confirmed by increased volume. 


Disclaimer:
Sahm is subject to the supervision and control of the CMA, pursuant to its license no. 22251-25 issued by CMA.
The Information presented above is for information purposes only, which shall not be intended as and does not constitute an offer to sell or solicitation for an offer to buy any securities or financial instrument or any advice or recommendation with respect to such securities or other financial instruments or investments. When making a decision about your investments, you should seek the advice of a professional financial adviser and carefully consider whether such investments are suitable for you in light of your own experience, financial position and investment objectives. The firm and its analysts do not have any material interests or conflicts of interest in any companies mentioned in this report.
Performance data provided is accurate and sourced from reliable platforms, including Argaam, TradingView, MarketWatch.
IN NO EVENT SHALL SAHM CAPITAL FINANCIAL COMPANY BE LIABLE FOR ANY DAMAGES, LOSSES OR LIABILITIES INCLUDING WITHOUT LIMITATION, DIRECT OR INDIRECT, SPECIAL, INCIDENTAL, CONSEQUENTIAL DAMAGES, LOSSES OR LIABILITIES, IN CONNECTION WITH YOUR RELIANCE ON OR USE OR INABILITY TO USE THE INFORMATION PRESENTED ABOVE, EVEN IF YOU ADVISE US OF THE POSSIBILITY OF SUCH DAMAGES, LOSSES OR EXPENSES.


The Information presented above is for education purposes only, which shall not be intended as and does not constitute an offer to sell or solicitation for an offer to buy any securities or financial instrument or any advice or recommendation with respect to such securities or other financial instruments or investments. When deciding about your investments, you should seek the advice of a professional financial adviser and carefully consider whether such investments are suitable for you in light of your own experience, financial position, and investment objectives.
In no event shall Sahm Capital Financial Company be liable for any damages, losses or liabilities including without limitation, direct or indirect, special, incidental, consequential damages, losses, or liabilities, in connection with your reliance on or use or inability to use the information presented above, even if you advise us of the possibility of such damages, losses or expenses.
Every question you ask will be answered
Scan the QR code to contact us
whatsapp
Also you can contact us via