We Value Your Feedback! Help us shape better content and experiences by participating in our survey. Join the Survey Now!
Saudi Market
TASI Technical Analysis:
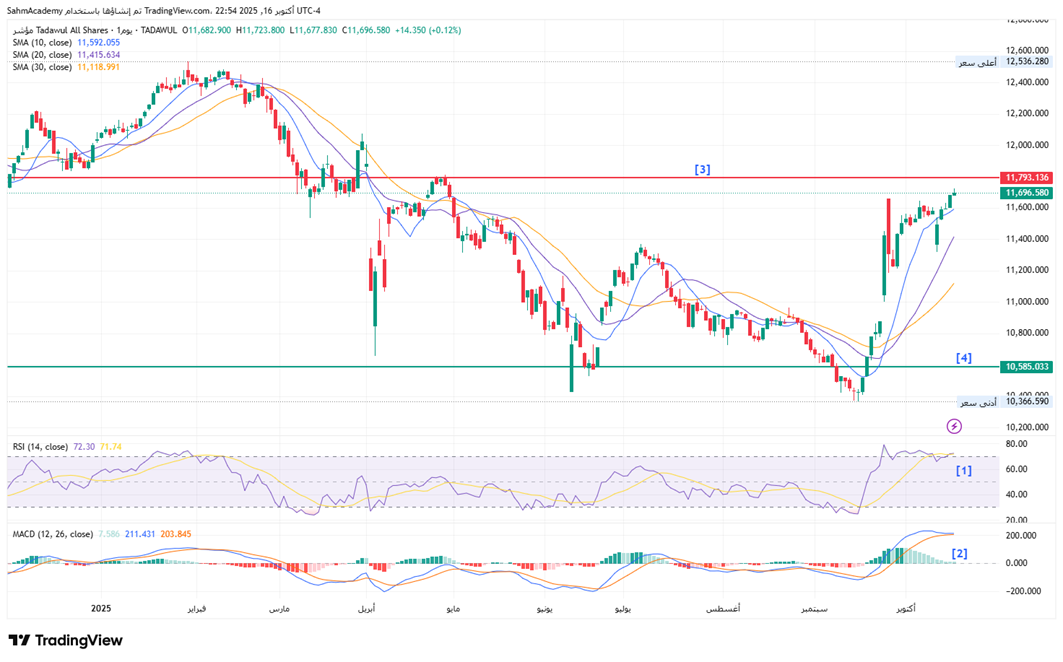
The Tadawul All Shares Index is currently trading at 11,696.58, having recovered significantly from its August lows near 10,600, representing approximately a 10% rally over the past two months. The price action reveals a well-defined downtrend that persisted from early February through August, during which the index declined roughly 7% from its peak of approximately 12,536. However, the recent recovery demonstrates a constructive shift in market structure. The simple moving averages 10-day at 11,592, 20-day at 11,415, and 30-day at 11,118 are now in a bullish alignment with price trading above all three, indicating strengthening short-term momentum.
[1] The RSI at 72.30 suggests the index is entering overbought territory, which warrants caution regarding potential pullbacks.
[2] MACD has recently turned positive with the histogram showing green bars, confirming bullish.
[3] From a technical perspective, the index has successfully reclaimed the September highs and is testing resistance near the 11,793 level, with the daily close of 11,696.58 positioning it just below this key threshold.
[4] The recovery from the August low of 10,600 represents a critical support level that investors should monitor, as a breach of this support would invalidate the bullish recovery narrative.
The current price action, combined with positive MACD divergence and the bullish MA configuration, suggests potential for further upside toward the psychological 12,000 level and potentially the February highs near 12,536, provided the index maintains above its 20-day moving average at 11,415. However, the elevated RSI reading at 72.30 necessitates caution a short-term pullback or consolidation phase would not be unexpected and should be viewed as a healthy corrective move rather than a reversal signal, particularly if support around 11,400-11,500 holds firm.
TASI Index Weekly Market Summary (October 12 to October 16)
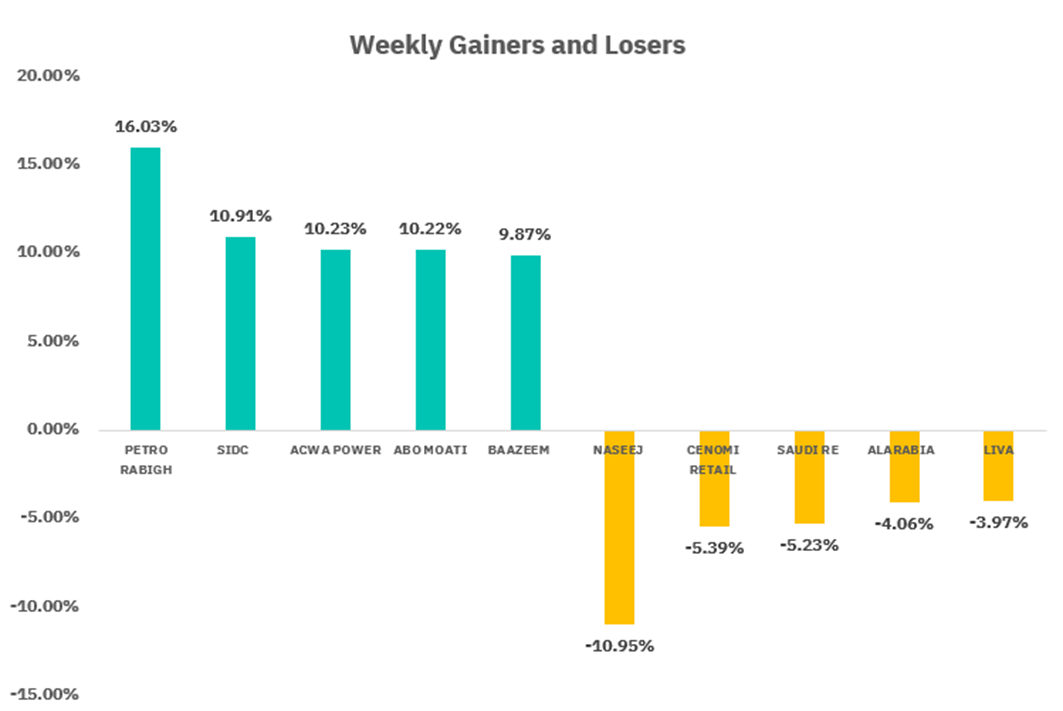
The TASI index increased by 1.76%. With a trading week of 5 days, the total trading volume reached 28 billion Saudi Riyals, averaging 5.7 billion per day.
From the perspective of individual stock performance, 154 companies saw their stock prices rise this week, while 111 companies saw their stock prices fall. The companies with the highest increase included PETRO RABIGH, SIDC, ACWA POWER, with increases of 16.03%, 10.91%, and 10.23% respectively. The companies with the highest decline included NASEEJ, CENOMI RETAIL, SAUDI RE with declines of 10.95%, 5.39%, and 5.23% respectively.
October 21:
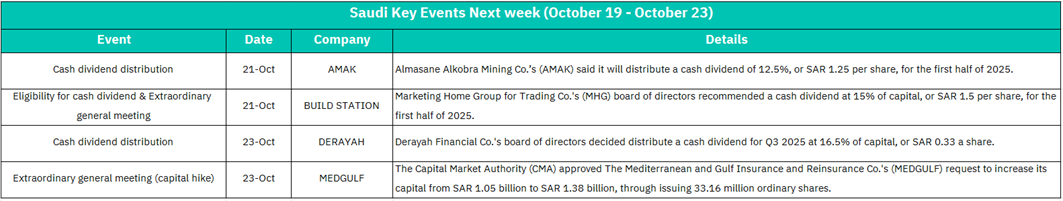
AMAK - Distribution of 12.5% cash dividend at SAR 1.25 per share for H1 2025
BUILD STATION - Eligibility for 15% cash dividend at SAR 1.5 per share for H1 2025 and Extraordinary General Meeting
Market Impact:
Both AMAK and BUILD STATION's dividend announcements demonstrate strong profitability and consistent cash generation. AMAK's 12.5% first-half dividend reflects Almasane Alkobra Mining Co.'s solid operational performance and mining sector resilience, while BUILD STATION's recommended 15% dividend signals strong earnings from Marketing Home Group for Trading Co. Both announcements are shareholder-friendly and could attract dividend-seeking investors to accumulate positions ahead of payment dates, providing price support and upward momentum for both stocks. The attractive dividend yields may drive buying interest and support broader market sentiment toward dividend-paying companies.
October 23:
DERAYAH - Distribution of 16.5% cash dividend at SAR 0.33 per share for Q3 2025
MEDGULF - Extraordinary General Meeting for capital increase from SAR 1.05 billion to SAR 1.38 billion through issuance of 33.16 million ordinary shares
Market Impact: Mixed sentiment for the market. Derayah Financial Co.'s Q3 dividend distribution at 16.5% is strongly positive, demonstrating robust profitability and consistent cash flow generation. The attractive dividend yield could attract income-focused investors to accumulate positions, providing upward price momentum and supporting the financial services sector sentiment. However, MEDGULF's capital increase of approximately 31% through new share issuance presents a more nuanced outlook. While the expansion strengthens The Mediterranean and Gulf Insurance and Reinsurance Co.'s capital base and signals management confidence in long-term growth opportunities, the new issuance may trigger near-term dilution concerns for existing shareholders. The positive impact from DERAYAH's strong dividend may be partially offset by potential selling pressure on MEDGULF due to dilution fears. Overall, investors should focus on DERAYAH for income opportunities while monitoring MEDGULF's post-approval performance to assess whether strategic benefits justify short-term share dilution.
U.S. Market
S&P500 Technical Analysis:
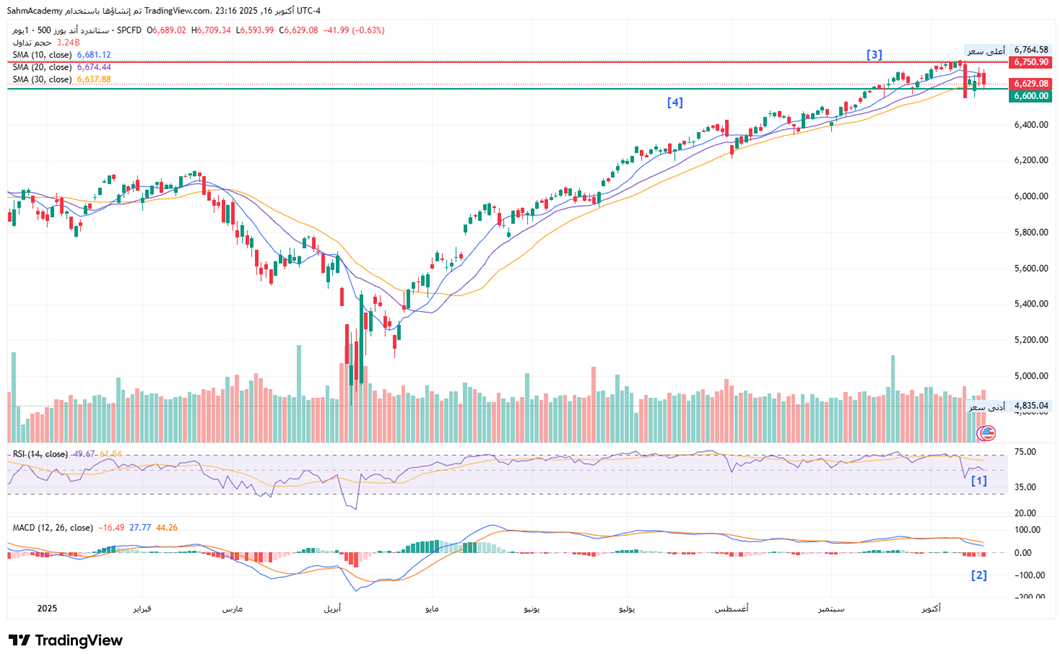
The index has demonstrated remarkable strength throughout 2025, appreciating approximately 11% from the January lows near 5,950 to the recent peak, representing a robust bull market trajectory. The simple moving average structure remains constructively aligned with the 10-day at 6,681.12, 20-day at 6,674.44, and 30-day at 6,637.88, all trading in close proximity and positioned above current price, indicating a late-stage uptrend that is showing signs of potential consolidation.
[1] The RSI at 49.67 suggests the index is neither overbought nor oversold, providing room for further directional moves.
[2] MACD histogram has turned negative with the signal lines crossing, indicating a potential loss of momentum and warranting closer monitoring of short-term technicals.
[3] From a structural perspective, the S&P 500 has faced resistance in the 6,750 zone, which represents a critical inflection point following the powerful rally from May through October. The current pullback from the intraday high, combined with the negative MACD divergence and deteriorating histogram, suggests profit-taking and potential consolidation rather than a trend reversal.
[4] Key support levels to monitor include the 20-day moving average at 6,674 and the 30-day at 6,637, with the broader support cluster around 6,600 representing an important technical floor.
A break below the 30-day moving average would signal a more concerning deterioration in short-term uptrend momentum. Conversely, should the index stabilize and recapture the 6,700 level with positive MACD divergence, it could attempt another run toward the all-time highs, though investors should exercise caution given the extended nature of the rally and elevated valuation backdrop.
October 23:
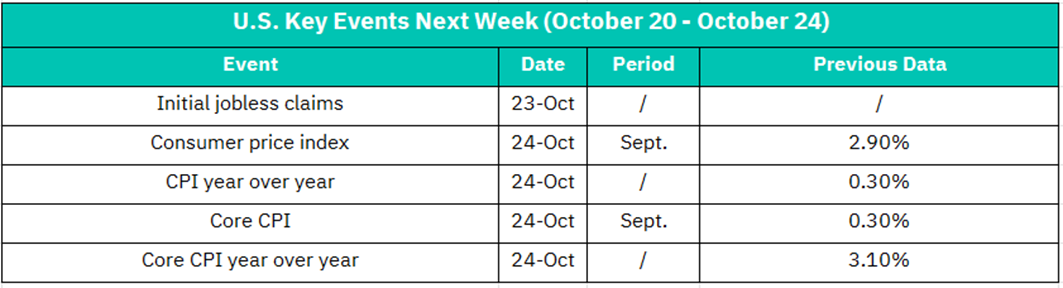
Initial Jobless Claims
Market Impact: Initial jobless claims data provides immediate insight into labor market health. A higher-than-expected reading could signal economic weakness and potentially trigger a risk-off sentiment in equities, benefiting bonds and defensive sectors. Conversely, a lower-than-expected figure would reinforce the strength of the job market, supporting equity valuations and potentially lifting cyclical stocks. The market typically responds with moderate volatility, particularly affecting Treasury yields and sector rotation between defensive and growth stocks.
October 24:
Consumer Price Index (CPI) - Sept. Period | Previous: 2.90%
CPI Year-over-Year | Previous: 0.30%
Core CPI - Sept. Period | Previous: 0.30%
Core CPI Year-over-Year | Previous: 3.10%
Market Impact: This is the most significant economic event of the week. These four inflation metrics are critical for Federal Reserve policy decisions and will drive market direction across all asset classes. A "hot" inflation report (higher readings across the board) would likely result in broad equity market selloffs, particularly pressuring growth and tech stocks, while Treasury yields spike upward and the market prices in prolonged higher interest rates. Conversely, a "cool" inflation report (lower readings) would support equity market rallies, push Treasury yields lower, and likely trigger sector rotation toward growth stocks and interest-rate-sensitive sectors. The Core CPI Year-over-Year reading is especially crucial, as it is the Fed's preferred metric for gauging long-term inflation persistence and policy direction. Expect heightened volatility across all asset classes including FX markets, commodities, and crypto.
Crypto ETF Technical Analysis:
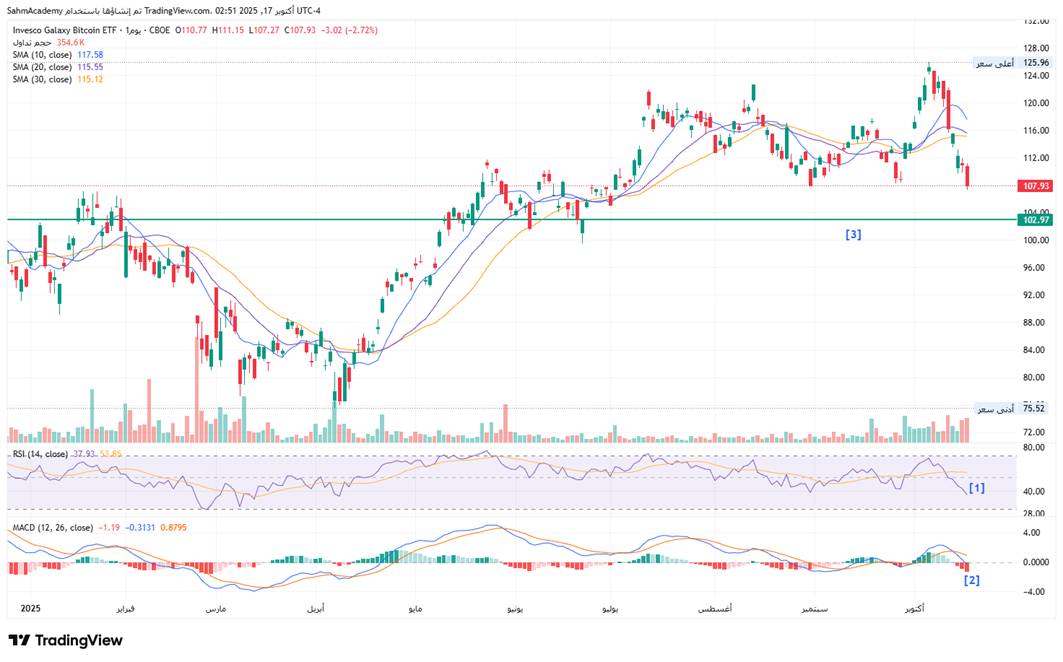
BTCO is currently trading at 107.93, having declined from an intraday high of 111.15 and a recent peak of 125.96 in September. The ETF has experienced significant volatility throughout 2025, rising approximately 42% from the January lows near 76 to the September highs, but subsequently retracing roughly 14% from those peaks, indicating profit-taking and consolidation in the cryptocurrency space. The simple moving average configuration shows the 10-day at 117.58, 20-day at 115.55, and 30-day at 115.12, all trading meaningfully above current price, signaling a deterioration in short-term uptrend structure and suggesting the asset has fallen below key support levels.
[1] The RSI at 37.93 indicates the ETF is approaching oversold conditions but not yet there, providing potential for further downside before capitulation signals emerge.
[2] MACD has turned negative with a deteriorating histogram showing red bars, confirming the loss of bullish momentum and the emergence of bearish technicals.
[3] Key support levels are identified at $103.
The elevated volume bars visible on the chart during recent declines suggest institutional selling, which is a bearish technical signal. However, the oversold RSI at 37.93 combined with the Bitcoin's historical volatility pattern suggests a potential near-term bounce or consolidation opportunity, particularly if the index stabilizes above 105-107. For a recovery of the uptrend, BTCO would need to recapture and hold above the 20-day moving average at 115.55, with a break above 120 required to invalidate the bearish technical setup and re-establish the longer-term bullish narrative.
Disclaimer:
Sahm is subject to the supervision and control of the CMA, pursuant to its license no. 22251-25 issued by CMA.
The Information presented above is for information purposes only, which shall not be intended as and does not constitute an offer to sell or solicitation for an offer to buy any securities or financial instrument or any advice or recommendation with respect to such securities or other financial instruments or investments. When making a decision about your investments, you should seek the advice of a professional financial adviser and carefully consider whether such investments are suitable for you in light of your own experience, financial position and investment objectives. The firm and its analysts do not have any material interests or conflicts of interest in any companies mentioned in this report.
Performance data provided is accurate and sourced from reliable platforms, including Argaam, TradingView, MarketWatch.
IN NO EVENT SHALL SAHM CAPITAL FINANCIAL COMPANY BE LIABLE FOR ANY DAMAGES, LOSSES OR LIABILITIES INCLUDING WITHOUT LIMITATION, DIRECT OR INDIRECT, SPECIAL, INCIDENTAL, CONSEQUENTIAL DAMAGES, LOSSES OR LIABILITIES, IN CONNECTION WITH YOUR RELIANCE ON OR USE OR INABILITY TO USE THE INFORMATION PRESENTED ABOVE, EVEN IF YOU ADVISE US OF THE POSSIBILITY OF SUCH DAMAGES, LOSSES OR EXPENSES.