Catalog

NVIDIA (NVDA): The "Blackwell" Era Begins — Why the AI Bubble Myth is Shattered Amazon: The Awakening Giant Can End of U.S. Government Shutdown Push S&P 500 Past All-Time Highs Again? Cherry IPO: Is 13x P/E Fair Value for Saudi Arabia's Car Rental Market? Bull Market or Bull Trap? S&P 500 Eyes 7,000 as Key Economic Data Looms! Broadcom (AVGO): Building the Backbone of the AI Era S&P 500 at 6,738 Awaits Fed's Verdict - Breakout Imminent? Saudi Kayan: From Market Leader to Restructuring—Can It Navigate the Downturn? U.S. Stocks Consolidate While Saudi Momentum Accelerates - Could CPI Change Everything? Micron (MU): The AI Super-Cycle's Core Beneficiary S&P 500 Hits Record Highs at 6,764 - Thursday's PPI Could Ignite Next Move! Almajdiah: How a 107x Oversubscribed IPO Masks Deteriorating Fundamentals S&P 500 Hits Record Highs at 6,715 - FOMC Minutes Could Ignite Next Move? MicroStrategy: The Leveraged Bitcoin Play - Dissecting the Dual-Loop Model Behind a $100B Valuation S&P 500 Eyes 6,800 Target as Jobs Data Looms - Will Bulls Break Through? Build Station: How It Tripled Equity While Profits Collapsed in Saudi's $70B Boom S&P 500 Flashes 'Golden Signal' at 6,631; PCE Data Could Trigger Epic 7,000 Run? AppLovin (APP): Deconstructing the $160 Billion Valuation: A Proven King or an Overpriced Hope? TASI hits “death cross”; Fed meeting could trigger a flip—historic opportunity? Saudi Chemical: How It Achieved 23% Revenue CAGR Amid Industry Pressure S&P 500 Surges, TASI Struggles – What’s Ahead? Alphabet: A Giant at the AI Crossroads - The Disrupted King or a Re-Crowned Emperor? Market Divergence Extreme: S&P Soars to Records as Bitcoin ETF Targets $105 Sport Clubs Analysis: How This Saudi Fitness Chain Cracked the Code Bitcoin Double-Top Breakdown While S&P 500 Flashes Warning Signals NVIDIA: From Chip Maker to AI's Full-Stack Architect S&P Reaches New Peaks, TASI Signals Wedge Pattern ACWA Power Analysis: Saudi-Backed Energy Giant's $250B Global Expansion Strategy TASI Flashes Major Reversal — Is This the Turning Point? Microsoft (MSFT): Cornerstone of the AI Empire TASI Crisis Point Meets S&P 500 Euphoria - Which Way Will Markets Swing? Miahona Analysis: Free Cash Flow Rockets 2,430% in 3 Years - The Next Big Thing? TASI Crashes as S&P 500 & Crypto Go Parabolic - Fed Week Alert! Circle (NYSE: CRCL): Minting the Digital Dollar, Defining the Future of Finance S&P500 Crushes All MAs as TASI Forms Bearish Triangle - Major Shift Ahead? Flynas Analysis: Saudi Arabia's Aviation Goldmine or High-Risk Gamble? Saudi Recovery Ignites as US Stocks Crush All-Time Records - What's Next? Robotaxi: The AI-Powered Revolution Reshaping Our Cities and Minting the Next Trillion-Dollar Market Saudi Market Rebounds, S&P 500 at Highs: Will It Last? CENOMI RETAIL Analysis: Financial Meltdown Raises Red Flags for Investors TASI’s Rebound Pattern Revealed: Spotting the Next Key Move US Investment Strategy Outlook: H2 2025 TASI Critical Support Test —Next Trading Opportunity Revealed! UCIC Analysis: 106% Profit Leap Amid Market Slowdown—What’s Next? Big Moves Ahead-The Signal Smart Money Can’t Ignore Why Smart Money Is Quietly Positioning for TASI's Breakout Perfect Presentation(2P) Analysis: Discount Trap or Hidden Goldmine? Secret Signals Flash Red: Major Market Shift Incoming? S&P 500 Flag Pattern Reveals Shocking Truth. What Happens Next? Mouwasat: Navigating Challenges and Seizing Growth in Saudi Healthcare The Hidden Signal Behind Market's Surprising Recover Markets Diverge: The Hidden Pattern Behind Last Week's Moves MASAR's Mirage: The Billion-Riyal Paradox Awaits Investors Market Crossroads: Hidden Signals Reveal Coming Opportunities? Tesla Beyond Cars: A Strategic Analysis of the EV Giant's Transformation into a Multi-Vertical Tech Opportunity Unveiled: Navigating the Saudi Market Recovery ENTAJ Analysis: Saudi Poultry Leader or Valuation Bubble? Saudi Market Alerts: Is TASI Showing Signs of Bottoming Out? Saudi Market Rebounds: Has the Bearish Trend Reversed? Crisis or Opportunity? Navigating Trump's Tariff Impact with Strategic Moves 106% Profit Explosion: Rasan's Revolution Reshaping Saudi Finance TASI rises 2.82%, Trump's tariff policy in focus this week In-Depth Equity Analysis: XPeng Inc. (XPEV) Weekly Report on Saudi and U.S. Stock: Technical Breakthroughs of Key Indices ELM Analysis: Investment Opportunities Under Sound Financials Saudi & US Markets Face Technical Corrections as Fed Decision Looms In-Depth Equity Analysis: Alibaba Group Holdings Ltd ADR (BABA) Global Markets Under Pressure, Saudi & US Indices Show Bearish Trends Tamkeen: Cash-Rich Leader, High Dividend Risk Alert TASI and S&P 500 Drop Over 2% Amid Broader Selling Momentum U.S. Stock Market Q1 Investment Strategy TASI Tests Resistance; US Key Data Imminent Nice One: Undervalued Opportunity In Beauty Digital Market Weekly Compass: Presidents' Day Pause & Saudi's Capital Markets Forum Take Center TASI Hits Overbought Zone, LEAP 2025 Fuels Tech Trends Weekly Report (January 26 – January 30) Weekly Report (January 19 – January 23) In-Depth Equity Analysis: Uber Technologies, Inc. (UBER) Weekly Report (January 12 – January 16) Weekly Report (January 5 – January 9) In-Depth Equity Analysis: Broadcom Inc. (AVGO) Weekly Report (December 29 – January 2) Weekly Report (December 22 – December 26) In-Depth Equity Analysis: On Holdings (ONON.NYSE) Weekly Report (December 15 – December 19) The AI Smart Glasses Boom and Must-Watch Stocks Salesforce: Surfing the AI Growth Wave for Market Leadership Meta: Can AI Drive Growth Amid Profit Pressures? Alibaba: Attractive Valuation Amid Growth and Policy Shifts NIO: Navigating Through the EV Storm PDD's Growth Dilemma: Challenge or Breakthrough? SMCI Stock Drops: Time to Invest? Nvidia Stock Rollercoaster: What's Ahead? US AI Investment Inflection Point: As NVIDIA Peaks, Palantir Takes Flight

Weekly Report (December 29 – January 2)

Exciting news! Sahm Research Center is launching a new Weekly Report section, and we want your input! Help us shape our content by taking a quick survey: Join the Survey

Your feedback is essential in creating a tailored experience just for you. Thank you for being part of our community!

Saudi Market 

TASI Technical Analysis:

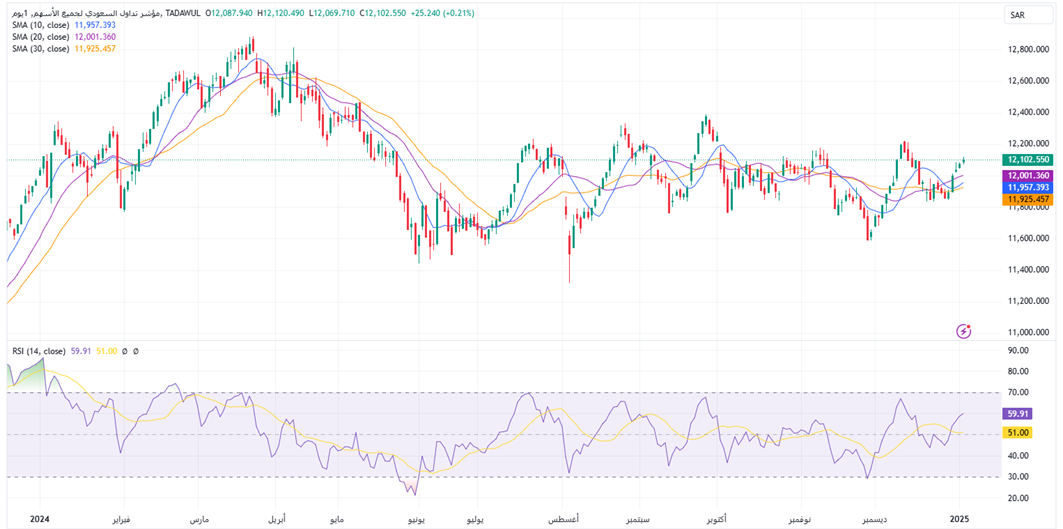
The 10-day SMA (blue line), 20-day SMA (purple line) and 30-day SMA (yellow line) are all trending upwards, and the 10-day SMA is currently trending upwards across the 20-day SMA, which indicates that market sentiment is positive in the short term.

The RSI value is 59.91, close to 60, which indicates that the market is currently in a relatively balanced state, with no obvious overbought or oversold signals. However, if the RSI continues to rise and exceeds 70, it may indicate that the market is overbought and prices may pull back.

TASI Index Weekly Market Summary (December 29, 2024 to January 2, 2025)

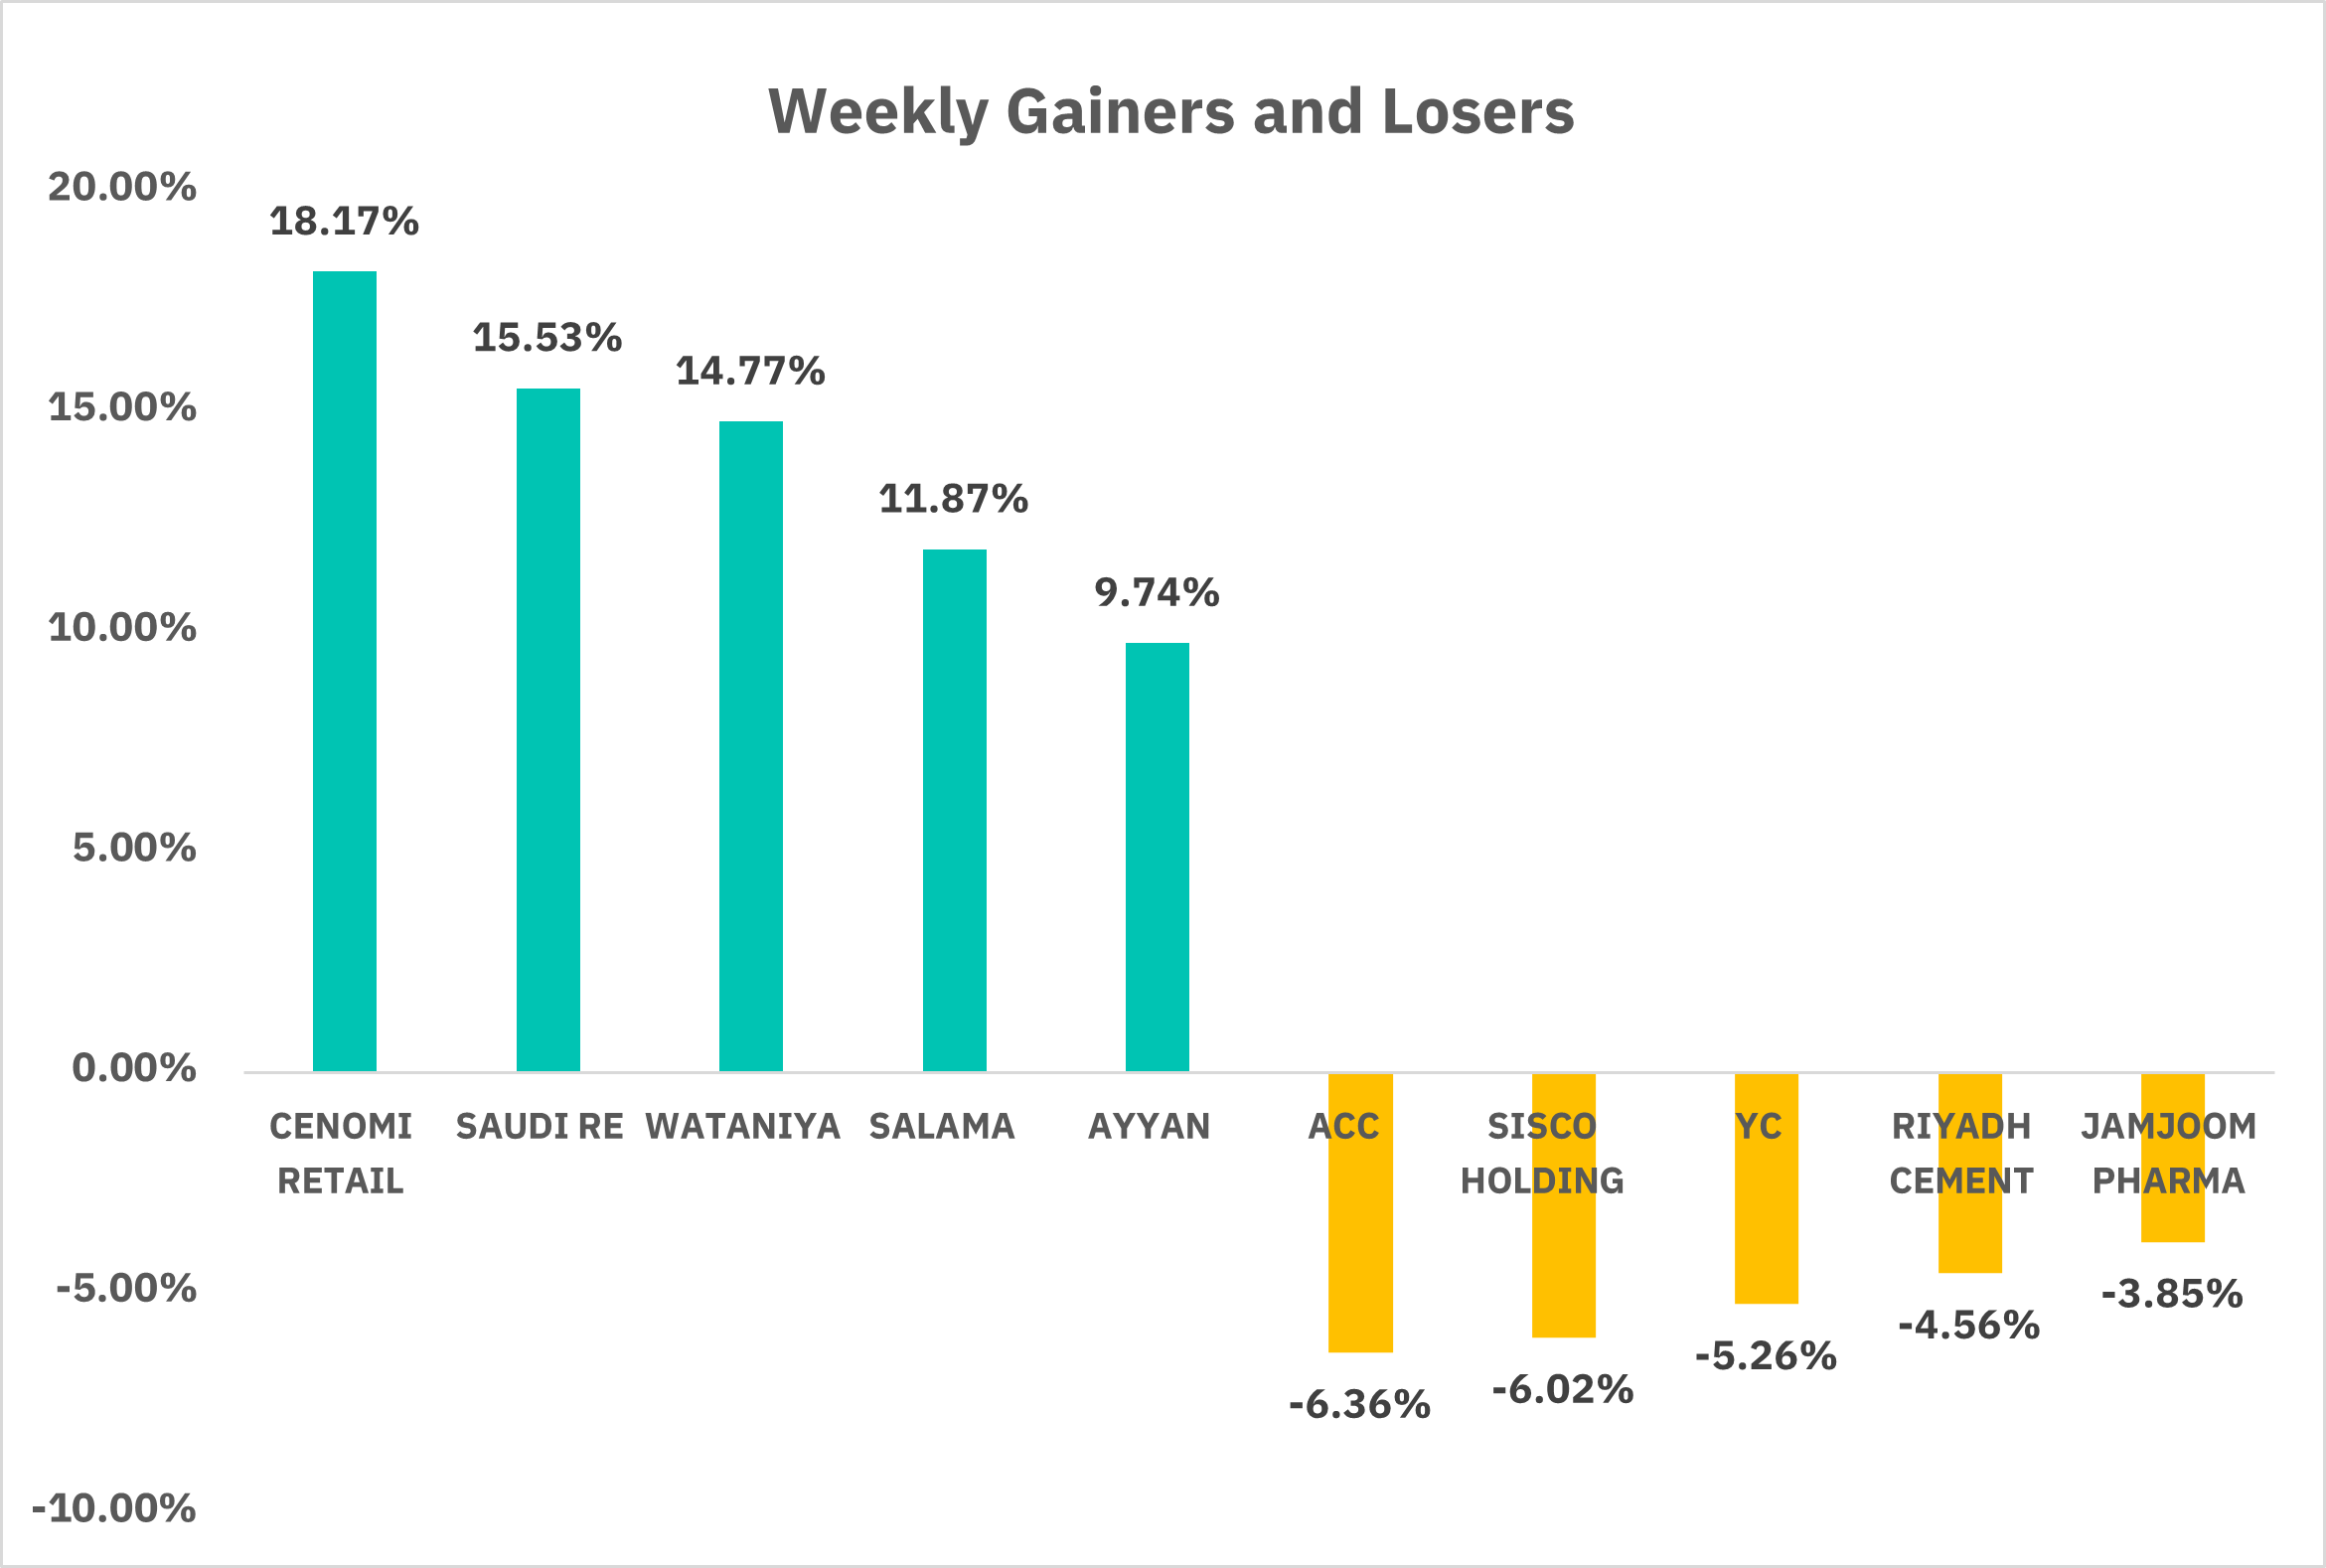
The TASI index closed up 1.76% last week, showing a steady upward trend, especially after the first trading day of 2025 (January 1), rising to 12,077. The average daily turnover is 4,668, million Saudi Riyals (SAR), Market liquidity remained stable last week. In terms of individual stock performance, 181 companies saw their share prices rise, while 70 companies experienced declines. CENOMI RETAIL and SAUDI RE were the top gainers, with gains of 18.17% and 15.53%. Conversely, ACC and SISCO HOLDING were the worst losers, with declines of 6.36% and 6.02%.

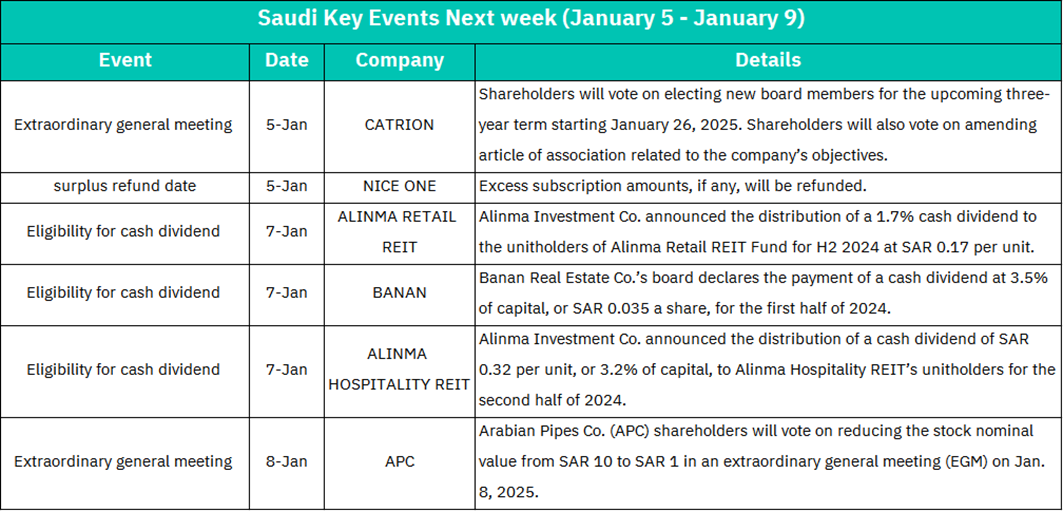
1. January 5: CATRION will hold an extraordinary general meeting of shareholders, where shareholders will vote to elect new board members for a three-year term starting on January 26, 2025. The holding of an extraordinary general meeting of shareholders means that the company's governance structure may change, and the election of new board members and the amendment of the company's articles of association may have an impact on the company's long-term strategy and performance. If NICE ONE has an oversubscription amount, a refund will be made on this day.

2. January 7: Alinma Investment Co. announced that it will distribute a cash dividend of 1.7% of capital for the second half of 2024, or SAR 0.17 per unit, to unitholders of Alinma Retail REIT Fund. The board of directors of Banan Real Estate Co. announced the payment of a cash dividend of 3.5% of capital for the first half of 2024, or SAR 0.035 per share. Alinma Investment Co. announced that it will distribute a cash dividend of SAR 0.32 per unit, or 3.2% of capital, to unitholders of Alinma Hospitality REIT for the second half of 2024. Eligibility for cash dividends today.

3. January 8: Shareholders of Arabian Pipes Co. (APC) will vote at an extraordinary general meeting on whether to reduce the par value of its shares from SAR 10 to SAR 1. Such a change could attract investors seeking a lower threshold for investment.

U.S. Market

S&P500 Technical Analysis:

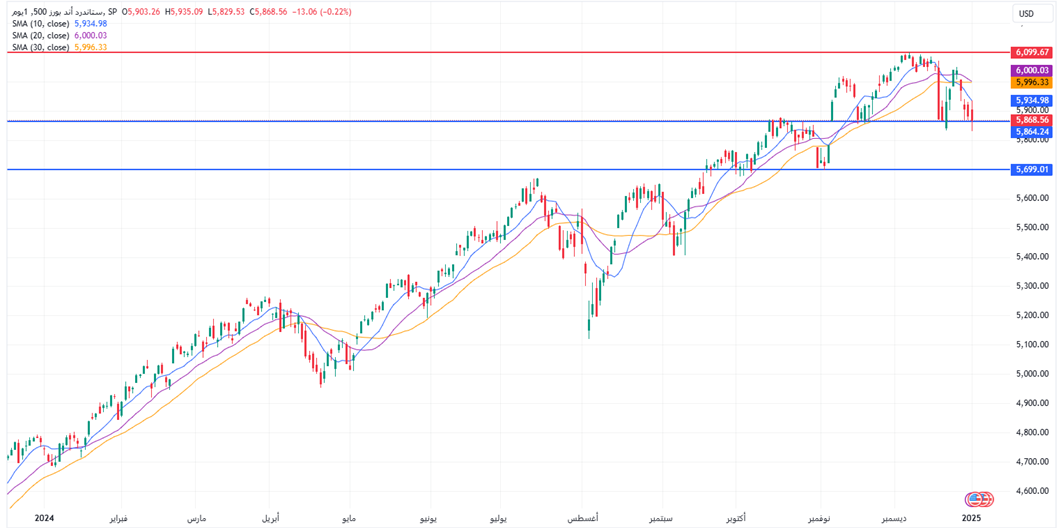
The S&P 500 decreased by 1.71%, The S&P 500 index reaching the support level of $5,699 again. The SMA 10 started to cross over the SMA 20 and SMA 30 downwards, which could be a bearish sign indicating that the price might continue to fall in the short term.

The U.S. stock market is in a "sell" mood last week. The market is worried about the performance of technology stocks in 2025. As the profit growth of large technology stocks slows down, the market generally expects that technology giants may find it difficult to dominate the market in 2025. Bank of America pointed out in the report: Bank of America's "Sell-Side Indicator SSI" rose 33 basis points to 57% in December, the highest level since the beginning of 2022. The indicator is still in the "neutral" range, but it is only 1 percentage point away from triggering a "sell" signal.

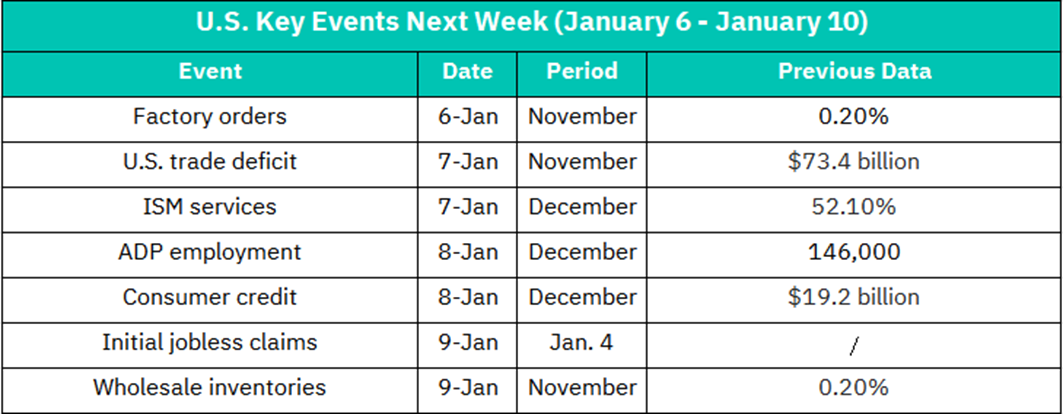
1. Factory orders - January 6: reflects November data, the previous value was 0.20%. An increase in factory orders is often seen as a signal of increased manufacturing activity and may have a positive impact on the stock market as it indicates an increase in economic activity.

2. U.S. trade deficit - January 7: November data will be released; the previous value was $73.4 billion. An increase in the trade deficit may have a negative impact on the US dollar because it means that the United States imports more than exports, which may lead to a depreciation of the US dollar.

3. ISM services - January 7: reflects December data, the previous value was 52.10%. A service index above 50% usually indicates expansion in the service industry, which may have a positive impact on market sentiment.

4. ADP employment - January 8: December data will be released; the previous value was 146,000. ADP employment data is an important indicator of private sector employment and has a certain reference value for predicting non-farm employment data.

5. Consumer credit - January 8: Will reflect December data, with the previous value of $19.2 billion. An increase in consumer credit may indicate that consumers are more confident and willing to take on more debt, which may have a positive impact on retail sales and overall economic activity.

6. Initial jobless claims - January 9: Will release data for January 4. A decrease in the number of unemployment claims is generally seen as a sign of a healthy job market.

7. Wholesale inventories - January 9: Will release November data, with the previous value of 0.20%. Changes in wholesale inventories can reflect companies' expectations for future sales.

Disclaimer:
Sahm is subject to the supervision and control of the CMA, pursuant to its license no. 22251-25 issued by CMA.
The Information presented above is for information purposes only, which shall not be intended as and does not constitute an offer to sell or solicitation for an offer to buy any securities or financial instrument or any advice or recommendation with respect to such securities or other financial instruments or investments. When making a decision about your investments, you should seek the advice of a professional financial adviser and carefully consider whether such investments are suitable for you in light of your own experience, financial position and investment objectives. The firm and its analysts do not have any material interests or conflicts of interest in any companies mentioned in this report.
Performance data provided is accurate and sourced from reliable platforms, including Argaam, TradingView, MarketWatch.
IN NO EVENT SHALL SAHM CAPITAL FINANCIAL COMPANY BE LIABLE FOR ANY DAMAGES, LOSSES OR LIABILITIES INCLUDING WITHOUT LIMITATION, DIRECT OR INDIRECT, SPECIAL, INCIDENTAL, CONSEQUENTIAL DAMAGES, LOSSES OR LIABILITIES, IN CONNECTION WITH YOUR RELIANCE ON OR USE OR INABILITY TO USE THE INFORMATION PRESENTED ABOVE, EVEN IF YOU ADVISE US OF THE POSSIBILITY OF SUCH DAMAGES, LOSSES OR EXPENSES.


The Information presented above is for education purposes only, which shall not be intended as and does not constitute an offer to sell or solicitation for an offer to buy any securities or financial instrument or any advice or recommendation with respect to such securities or other financial instruments or investments. When deciding about your investments, you should seek the advice of a professional financial adviser and carefully consider whether such investments are suitable for you in light of your own experience, financial position, and investment objectives.
In no event shall Sahm Capital Financial Company be liable for any damages, losses or liabilities including without limitation, direct or indirect, special, incidental, consequential damages, losses, or liabilities, in connection with your reliance on or use or inability to use the information presented above, even if you advise us of the possibility of such damages, losses or expenses.
Every question you ask will be answered
Scan the QR code to contact us
whatsapp
Also you can contact us via