
Saudi Market
TASI Technical Analysis:
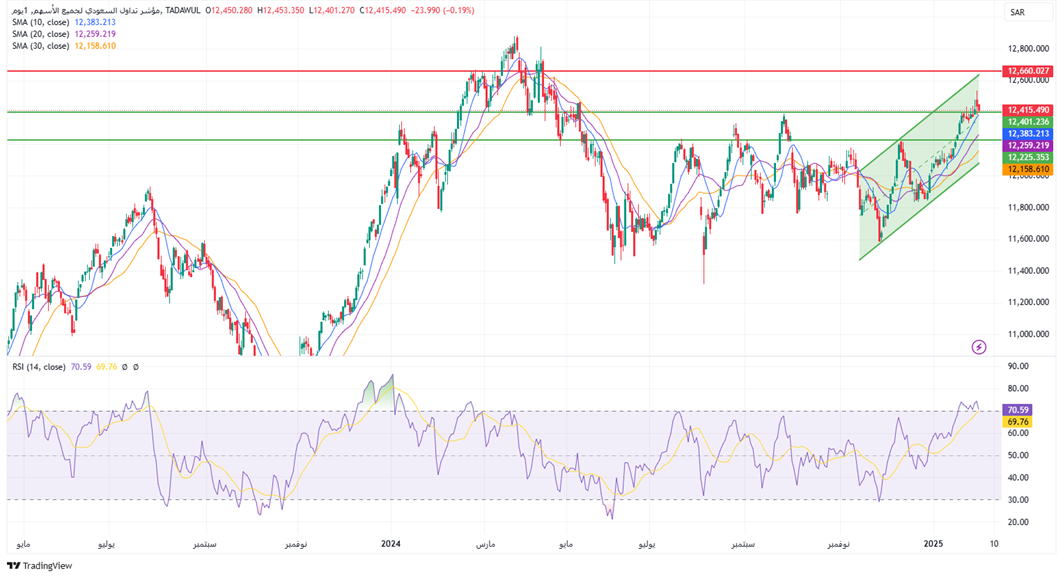
TASI continued its upward trend, with the index running steadily in the rising channel and approaching the key resistance area. From a technical perspective, the short-term moving averages (10-day, 20-day, and 30-day SMAs) are in a bullish arrangement, indicating that the market momentum is still relatively strong. However, the current index has broken through the resistance level of 12,401 points and is expected to further challenge the long-term resistance level of 12,660 points.
At the same time, the RSI (14) indicator has risen to 70.59, close to the overbought range, indicating that there may be some adjustment pressure in the short term. If the index is blocked and falls back at the current level, pay attention to the support levels of 12,259 (20-day SMA) and 12,158 (30-day SMA). If it falls below this area, it may open up further adjustment space.
Overall, the overall trend of TASI is still positive, but it faces key resistance tests in the short term. Investors can pay attention to the breakthrough of the index near 12,537 points. If it stabilizes effectively, they can follow the trend and go up; if it is blocked and pulled back, they should pay attention to the stabilization of the support level to find opportunities for bargain hunting.
TASI Index Weekly Market Summary (January 26 to January 30)
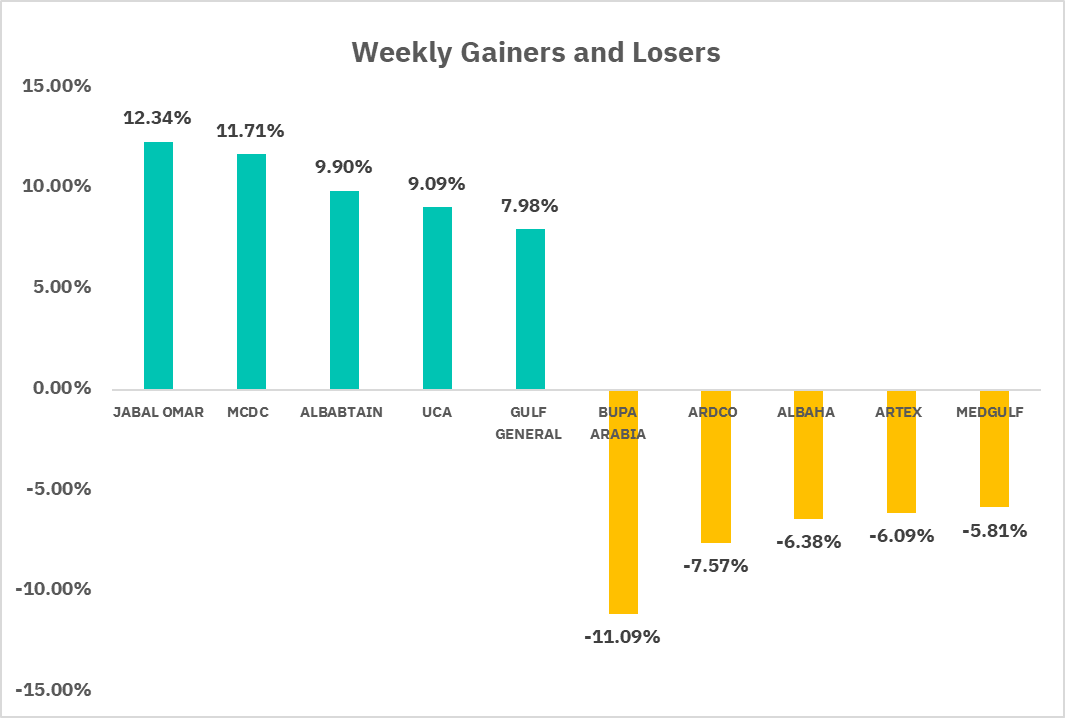
The TASI Index concluded the week at 12,415 points, marking a marginal gain of 0.24% amid mixed trading sessions. The index exhibited a gradual upward trajectory, peaking at 12,420 points on January 28, reflecting renewed investor confidence during mid-week trading. In terms of individual stock performance, 101 companies saw their share prices rise, while 152 companies experienced declines. JABAL OMAR and MCDC were the top gainers, with gains of 12.34% and 11.71%. Conversely, BUPA ARABIA and ARDCO, with loss of 11.09% and 7.57%.
The market’s slight upward momentum was supported by strong liquidity and selective sectoral demand, particularly in industrials. However, broader bearish sentiment persisted, as evidenced by the higher number of declining stocks. Investors exhibited caution toward healthcare sectors, contributing to the week’s mixed performance.
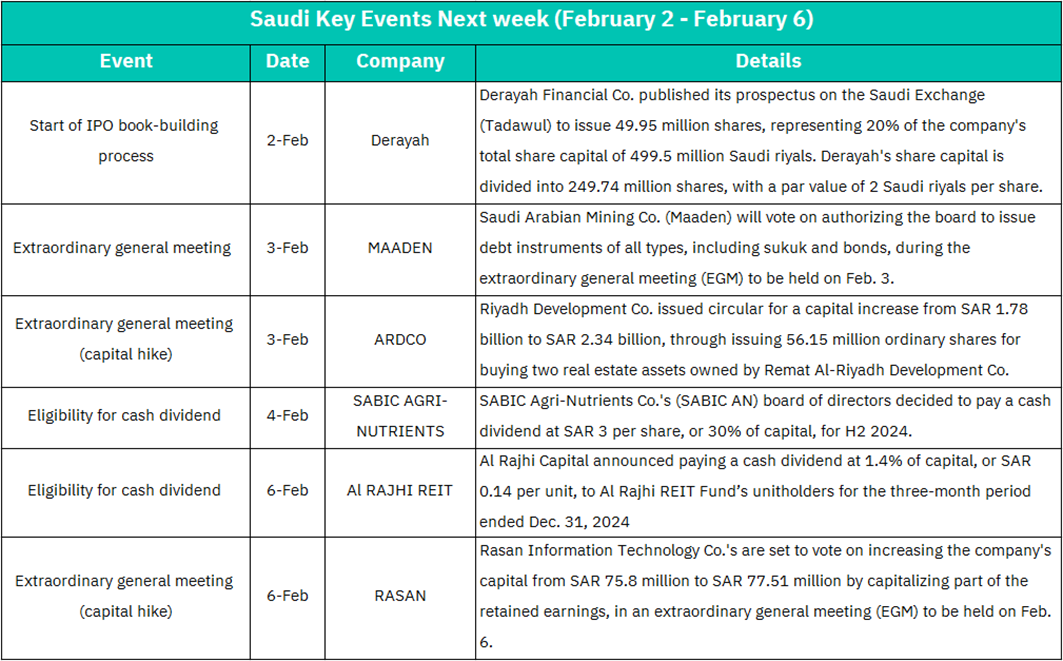
1. February 2: Derayah has started IPO book building to issue 20% of its shares (49.95 million shares), with a par value of 2 Saudi Riyals per share and a total share capital of 499.5 million Saudi Riyals. The listing of new shares may attract market liquidity and may trigger investment enthusiasm in the short term if the pricing is reasonable or the industry prospects are promising.
2. February 3: MAADEN's Extraordinary General Meeting of Shareholders (Debt Instrument Authorization) voted to authorize the Board of Directors to issue various debt instruments (including Islamic bonds Sukuk). If the debt is used for high-quality projects, it may promote long-term growth; the issuance of Sukuk may attract Islamic investors. ARDCO capital increased asset acquisition through the issuance of 56.15 million shares, the capital increased from 1.78 billion to 2.34 billion riyals, which were used to purchase real estate assets. If asset acquisitions improve profitability, it may be beneficial to the long-term stock price; additional issuance dilutes equity, but attention should be paid to asset quality and synergy effects. Equity dilution may trigger short-term selling pressure, and overvaluation of assets or failure of integration will drag down performance.
3. February 4: SABIC AGRI-NUTRIENTS is eligible to pay a cash dividend of SAR 3 per share (30% of share capital). The high dividend is attractive to income-seeking investors and shows that the company has a healthy cash flow.
4. February 6: AI RAJHI REIT is eligible for dividend distribution of SAR 0.14 per unit (1.4% of capital). Stable dividends enhance the attractiveness of REITs and are suitable for investors seeking regular cash flow. RASAN Capital Increase (Retained Earnings Transfer) Capital increased from 75.8 million riyals to 77.51 million riyals through retained earnings transfer. This capital expansion without diluting equity may be used for technology upgrades or market expansion, which is beneficial to long-term growth.
U.S. Market
S&P500 Technical Analysis:
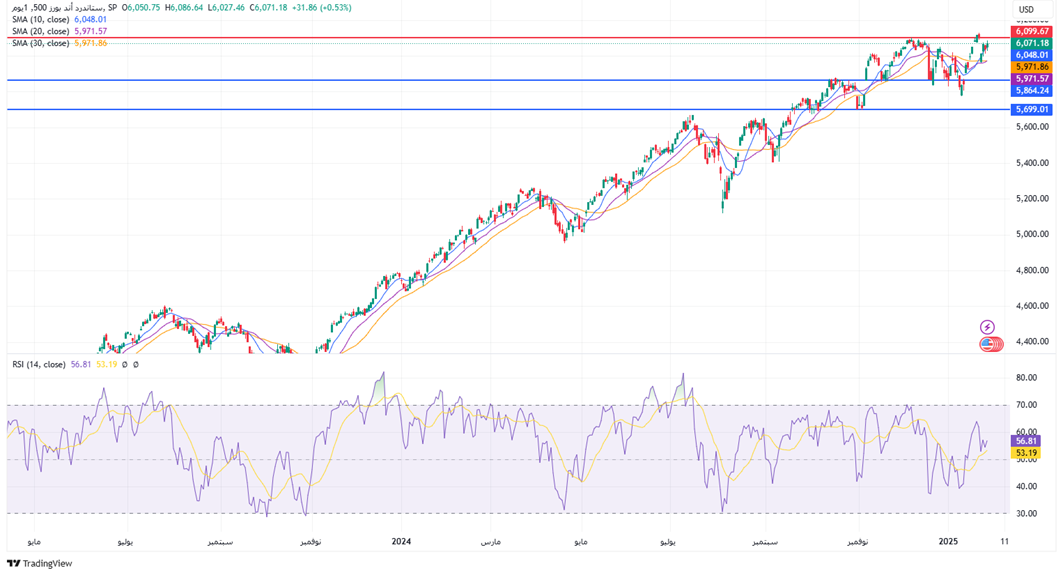
The S&P 500 index continued its bullish trend, continued to run in the rising channel, and approached the resistance level of 6,099.67 points. From a technical perspective, the short-term moving averages (10-day, 20-day, and 30-day SMAs) are still in a bullish arrangement, indicating that the overall market trend is strong. However, the current index has entered a key resistance area, and there may be a possibility of consolidation in the short term.
From the support level, 6,048 points (10-day SMA) is a short-term support, while 5,971 points (the intersection of 20-day and 30-day SMAs) constitutes a more critical technical support area. If the index pulls back to this range and stabilizes, it may provide a good opportunity to buy on dips. If it falls further, 5,864 points will become the next important support level, and a break below it may intensify the adjustment pressure.
RSI (14) is currently at a neutral level of 56.81, indicating that the market has not yet entered an overbought or oversold state, but compared with the previous high, the momentum has weakened, indicating that the market may face certain volatility needs in the short term.
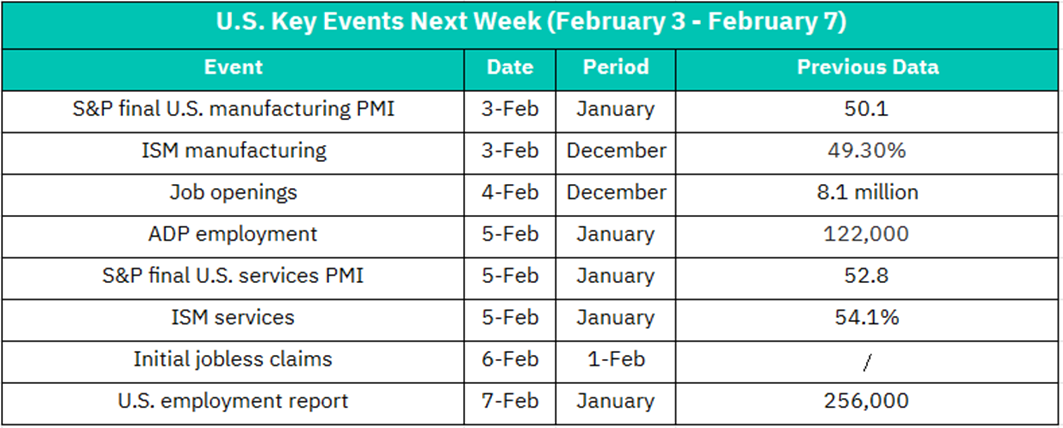
1. February 3: S&P Manufacturing PMI Previous value 50.1 (the boom-bust line is 50). If the manufacturing PMI maintains expansion (>50), it may ease market concerns about economic slowdown and boost industrial and cyclical stocks. ISM Manufacturing Index Previous value 49.3%, still in the contraction range. If the ISM Manufacturing Index rebounds above 50%, it may promote the short-term strength of the US dollar. If the data is lower than expected, it may intensify bets on the Fed's interest rate cuts, suppress US Treasury yields, and be bearish on manufacturing-related sectors.
2. February 4: Job openings previous value was 8.1 million, reflecting labor demand. If job vacancies continue to decline, it may indicate a cooling of the labor market, strengthen the Fed's expectations of a rate cut this year, and benefit growth stocks and technology stocks.
3. February 5: ADP employment previous value was 122,000, which is used as a forward-looking indicator of non-agricultural employment. If ADP employment exceeds expectations (such as >150,000), it may push up US bond yields and suppress highly valued assets; if it is lower than expected, the market may price in loose policies in advance.
The previous value of S&P service industry PMI was 52.8. The service industry accounts for more than 70% of the US economy. If the data continues to expand, it will show the resilience of consumption, which may support the overall performance of US stocks, especially the consumer and financial sectors.
The previous value of ISM service industry index was 54.1%, and attention should be paid to the inflation sub-item. If the ISM service industry inflation sub-item (such as the price payment index) rebounds, it may weaken the market's confidence in the decline of inflation, leading to an increase in expectations of interest rate hikes, which is bearish for the stock market in the short term.
4. February 6: The previous value of initial jobless claims was 214,000. Non-farm data is the core focus. If new employment exceeds expectations (such as >200,000), it may suppress expectations of interest rate cuts, push up the US dollar and US bond yields, and drag down technology stocks; if employment growth is weak (such as <150,000), it may trigger market concerns about economic recession, but it will strengthen expectations of interest rate cuts, which is good for the bond market and growth stocks.
5. February 7: The previous value of U.S. employment was 256,000, and the unemployment rate is expected to remain low (currently 3.7%). If the number of initial unemployment claims continues to rise, it may indicate a loosening of the labor market and increase market volatility.
Crypto ETF Technical Analysis:
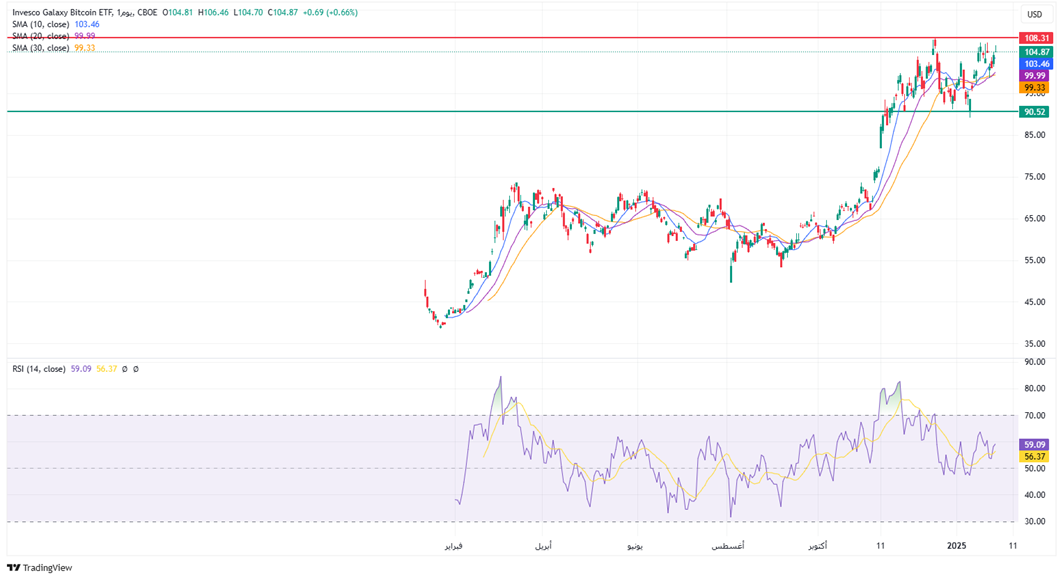
At present, BTCO maintains an upward trend. In the short term, we should pay attention to the breakthrough of $108.31. If it successfully stabilizes, the market is expected to rise further and challenge $110 or even higher. However, if there is a short-term adjustment, we need to pay attention to the support strength of $103.46 and the range of $99.99~99.33. Overall, the market sentiment is still positive, but it may fluctuate in the short term to accumulate strength to break through the key resistance level.
on Thursday, led by Jerome Powell, resulted in maintaining the policy rate at 4.25-4.50 percent. This decision marks the first under U.S. President Donald Trump's administration after three consecutive rate cuts in 2024. Powell stated in a post-policy press conference that there is no urgency to adjust the policy stance, as officials aim to see further progress on inflation.
Interest rate decisions have significant implications for the cryptocurrency market. Higher rates can make traditional investments more attractive, potentially decreasing demand for Bitcoin. Conversely, lower rates can boost Bitcoin by making other investments less appealing. Additionally, higher rates might strengthen the dollar, negatively impacting Bitcoin's price, while lower rates could have the opposite effect.
Disclaimer:
Sahm is subject to the supervision and control of the CMA, pursuant to its license no. 22251-25 issued by CMA.
The Information presented above is for information purposes only, which shall not be intended as and does not constitute an offer to sell or solicitation for an offer to buy any securities or financial instrument or any advice or recommendation with respect to such securities or other financial instruments or investments. When making a decision about your investments, you should seek the advice of a professional financial adviser and carefully consider whether such investments are suitable for you in light of your own experience, financial position and investment objectives. The firm and its analysts do not have any material interests or conflicts of interest in any companies mentioned in this report.
Performance data provided is accurate and sourced from reliable platforms, including Argaam, TradingView, MarketWatch.
IN NO EVENT SHALL SAHM CAPITAL FINANCIAL COMPANY BE LIABLE FOR ANY DAMAGES, LOSSES OR LIABILITIES INCLUDING WITHOUT LIMITATION, DIRECT OR INDIRECT, SPECIAL, INCIDENTAL, CONSEQUENTIAL DAMAGES, LOSSES OR LIABILITIES, IN CONNECTION WITH YOUR RELIANCE ON OR USE OR INABILITY TO USE THE INFORMATION PRESENTED ABOVE, EVEN IF YOU ADVISE US OF THE POSSIBILITY OF SUCH DAMAGES, LOSSES OR EXPENSES.
