What is a wedge?
A wedge is a price pattern marked by converging trend lines on a price chart. The two trend lines are drawn to connect the respective highs and lows of a price series over the periods of time. The lines show that the highs and the lows are either rising or falling at differing rates, giving the appearance of a wedge as the lines approach a convergence.
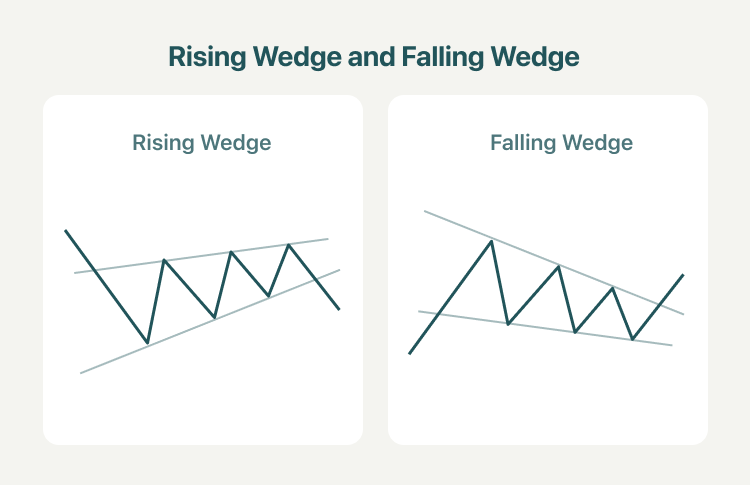
The two forms of the wedge pattern are a rising wedge and a falling wedge. A rising wedge signals a bullish reversal, and a falling wedge signals a bearish reversal. In either case, this pattern holds three common characteristics:
- The converging trend lines
- The magnitude of price movement within the wedge pattern is decreasing
- A breakout from one of the trend lines
What is a rising wedge pattern?
A rising wedge is a bearish chart pattern consisting of two converging trend lines, with the first line connecting the recent lower highs and higher highs, and a second trend line connecting the recent lows.
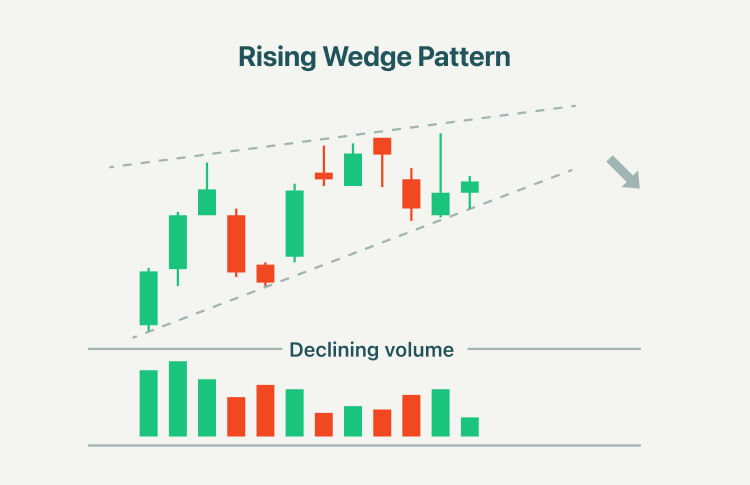
The rising wedge pattern can be interpreted as a bearish wedge as the low is overtaking the high in which the lower supporting trend line is steeper. The rising wedge pattern in which the trading volume decreases as the wedge progresses signals the future falling prices or a breakout to a downtrend, making it a bearish pattern. The decreases in trading volume could suggest that sellers are consolidating their power for a bearish breakout despite the wedge capturing the price action and moving higher.
What is a falling wedge pattern?
When an asset's price has been falling over time, a wedge pattern can occur just as the trend makes its final downward move. The trend lines drawn above the highs and below the lows on the price chart pattern can converge as the price slide loses momentum and buyers step in to slow the rate of decline.
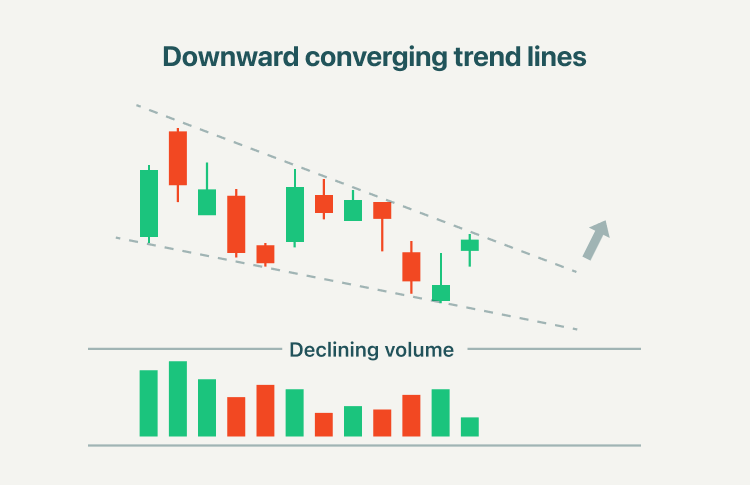
When a falling wedge occurs in an overall downtrend, it signals slowing downside momentum. This may forecast a rally in price if and when the price moves higher, breaking out of the pattern. When the price breaks the upper trend line, the asset is expected to reverse and trend higher. Traders identifying bullish reversal signals would want to look for trades that benefit from the asset’s rise in price.
How to trade with rising wedge and falling wedge patterns?
1. Rising wedge trading strategy
A rising wedge is generally a bearish signal as it indicates a possible reversal during an uptrend. Rising wedge patterns indicate the likelihood of falling prices after a breakout through the lower trend line.
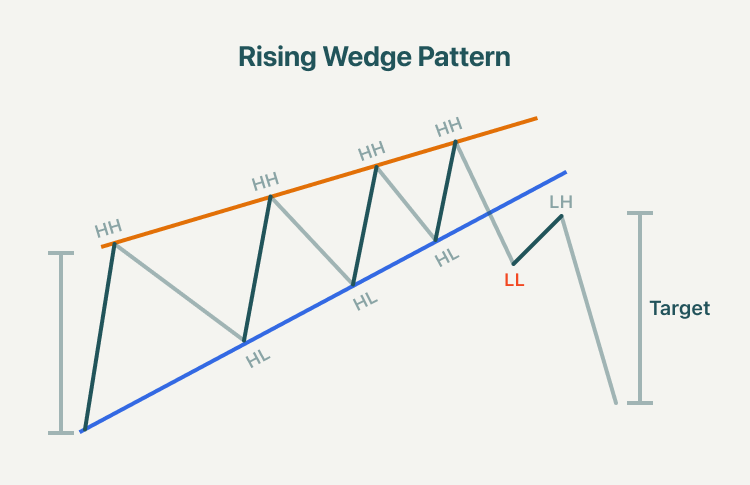
In rising wedge trading, the first thing is to identify the wedge pattern in which the first trend line will meet the higher lows of swings in an upward direction, and the second line will meet the higher highs of swings in the upward direction. Once we identify the wedge, we need to watch for the breakout. It’s worth noting that a higher volume behind the break is great evidence that the breakout is happening. After the breakout is confirmed, traders could open a short position if the price falls below the lower trendline of a rising wedge.
2. Trading with a falling wedge pattern
The falling wedge in the downtrend indicates a reversal to an uptrend. The pattern connecting the lower highs and lower lows will reveal the slight downward slant to the wedge pattern before the price eventually rises, resulting in a falling wedge breakout to resume the larger uptrend.
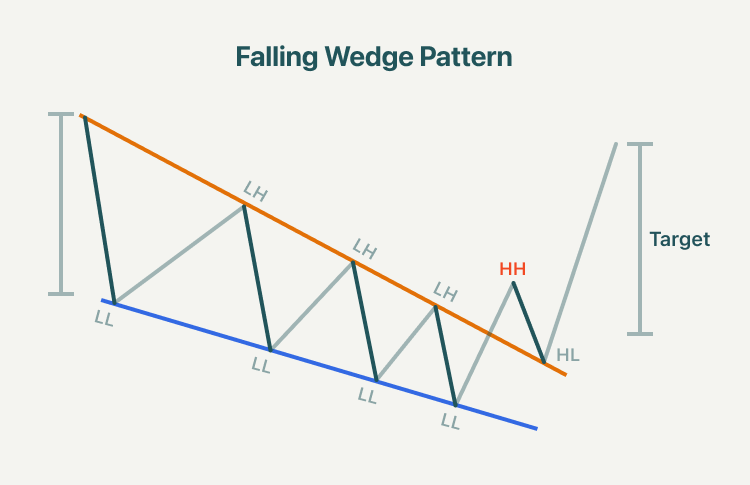
A break and close above the resistance trendline would the entry into the market, so traders may place a buy order, and a stop loss can be placed below the recent swing low, while the profit target can be placed according to the starting point of the descending wedge pattern and measure the vertical distance between support and resistance, then superimpose that same distance ahead of the current price but only once there has been a breakout. In addition, traders can look to the volume indicator to see higher volume in the moving up.
Summary:
- A wedge is a price pattern marked by converging trend lines on a price chart. The two trend lines are drawn to connect the respective highs and lows of a price series over the periods of time.
- The two forms of the wedge pattern are a rising wedge and a falling wedge. A rising wedge signals a bullish reversal, and a falling wedge signals a bearish reversal.
- A rising wedge is a bearish chart pattern consisting of two converging trend lines, with the first line connecting the recent lower highs and higher highs, and a second trend line connecting the recent lows.
- A rising wedge is generally a bearish signal as it indicates a possible reversal during an uptrend. Rising wedge patterns indicate the likelihood of falling prices after a breakout through the lower trend line.
- The falling wedge pattern is a continuation pattern formed when the price bounces between two downward-sloping, converging trendlines. It is considered a bullish chart pattern but can indicate both reversal and continuation patterns depending on where it appears in the trend.
- The falling wedge in the downtrend indicates a reversal to an uptrend. The pattern connecting the lower highs and lower lows will reveal the slight downward slant to the wedge pattern before the price eventually rises, resulting in a falling wedge breakout to resume the larger uptrend.


