
We Value Your Feedback! Help us shape better content and experiences by participating in our survey. Join the Survey Now!
Saudi Market
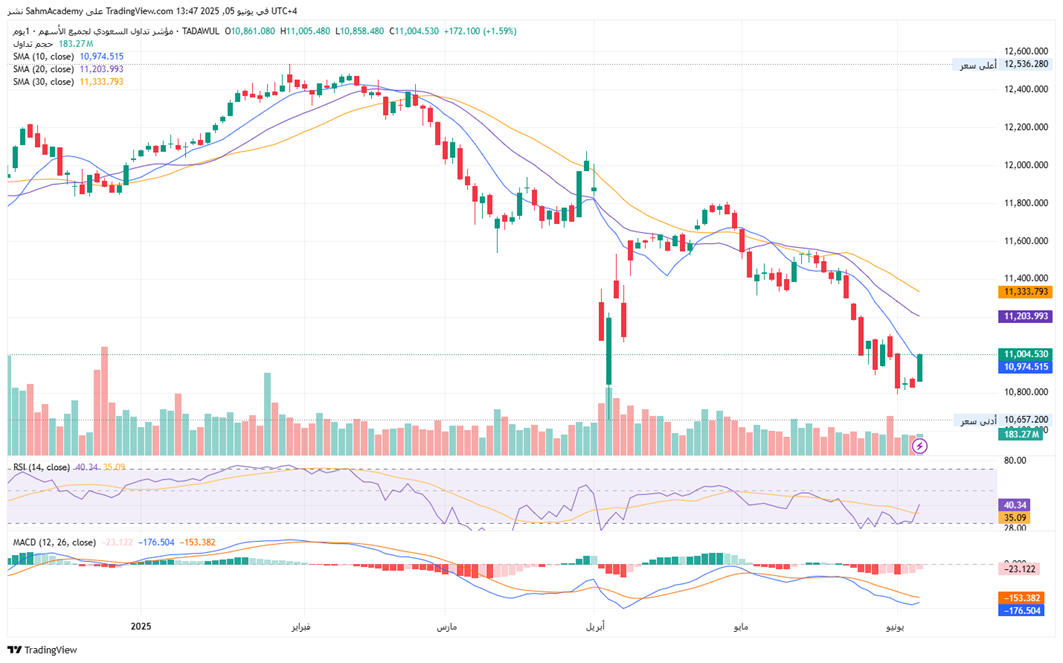
TASI Technical Analysis:
The Tadawul All Share Index (TASI) is entrenched in a confirmed bear market, currently trading at 10,861 (-1.59% daily) on concerning below-average volume (183M). Technical structure exhibits complete bearish alignment: price resides below all key SMAs (10/20/30-period) which now act as dynamic resistance, while MACD histogram expansion (-23.12) and negative cross confirm accelerating downside momentum. The index is testing critical support at 10,850, with a breach likely triggering a test of the 52-week low (10,657). RSI (40.34) approaches oversold territory but lacks bullish divergence, and the descending volume profile indicates institutional disinterest and potential capitulation. Given the deteriorating market structure, professional capital preservation mandates prevail—maintain defensive positioning, avoid new longs, and defer entry until confirmed reversal with volume expansion and fundamental catalysts. Current risk-reward asymmetrically favors downside continuation.
TASI Index Weekly Market Summary (June 1 to June 5)
The TASI index increased by 1.66%. With a trading week of 4 days, the total trading volume reached 16 billion Saudi Riyals, averaging 4.1 billion per day.
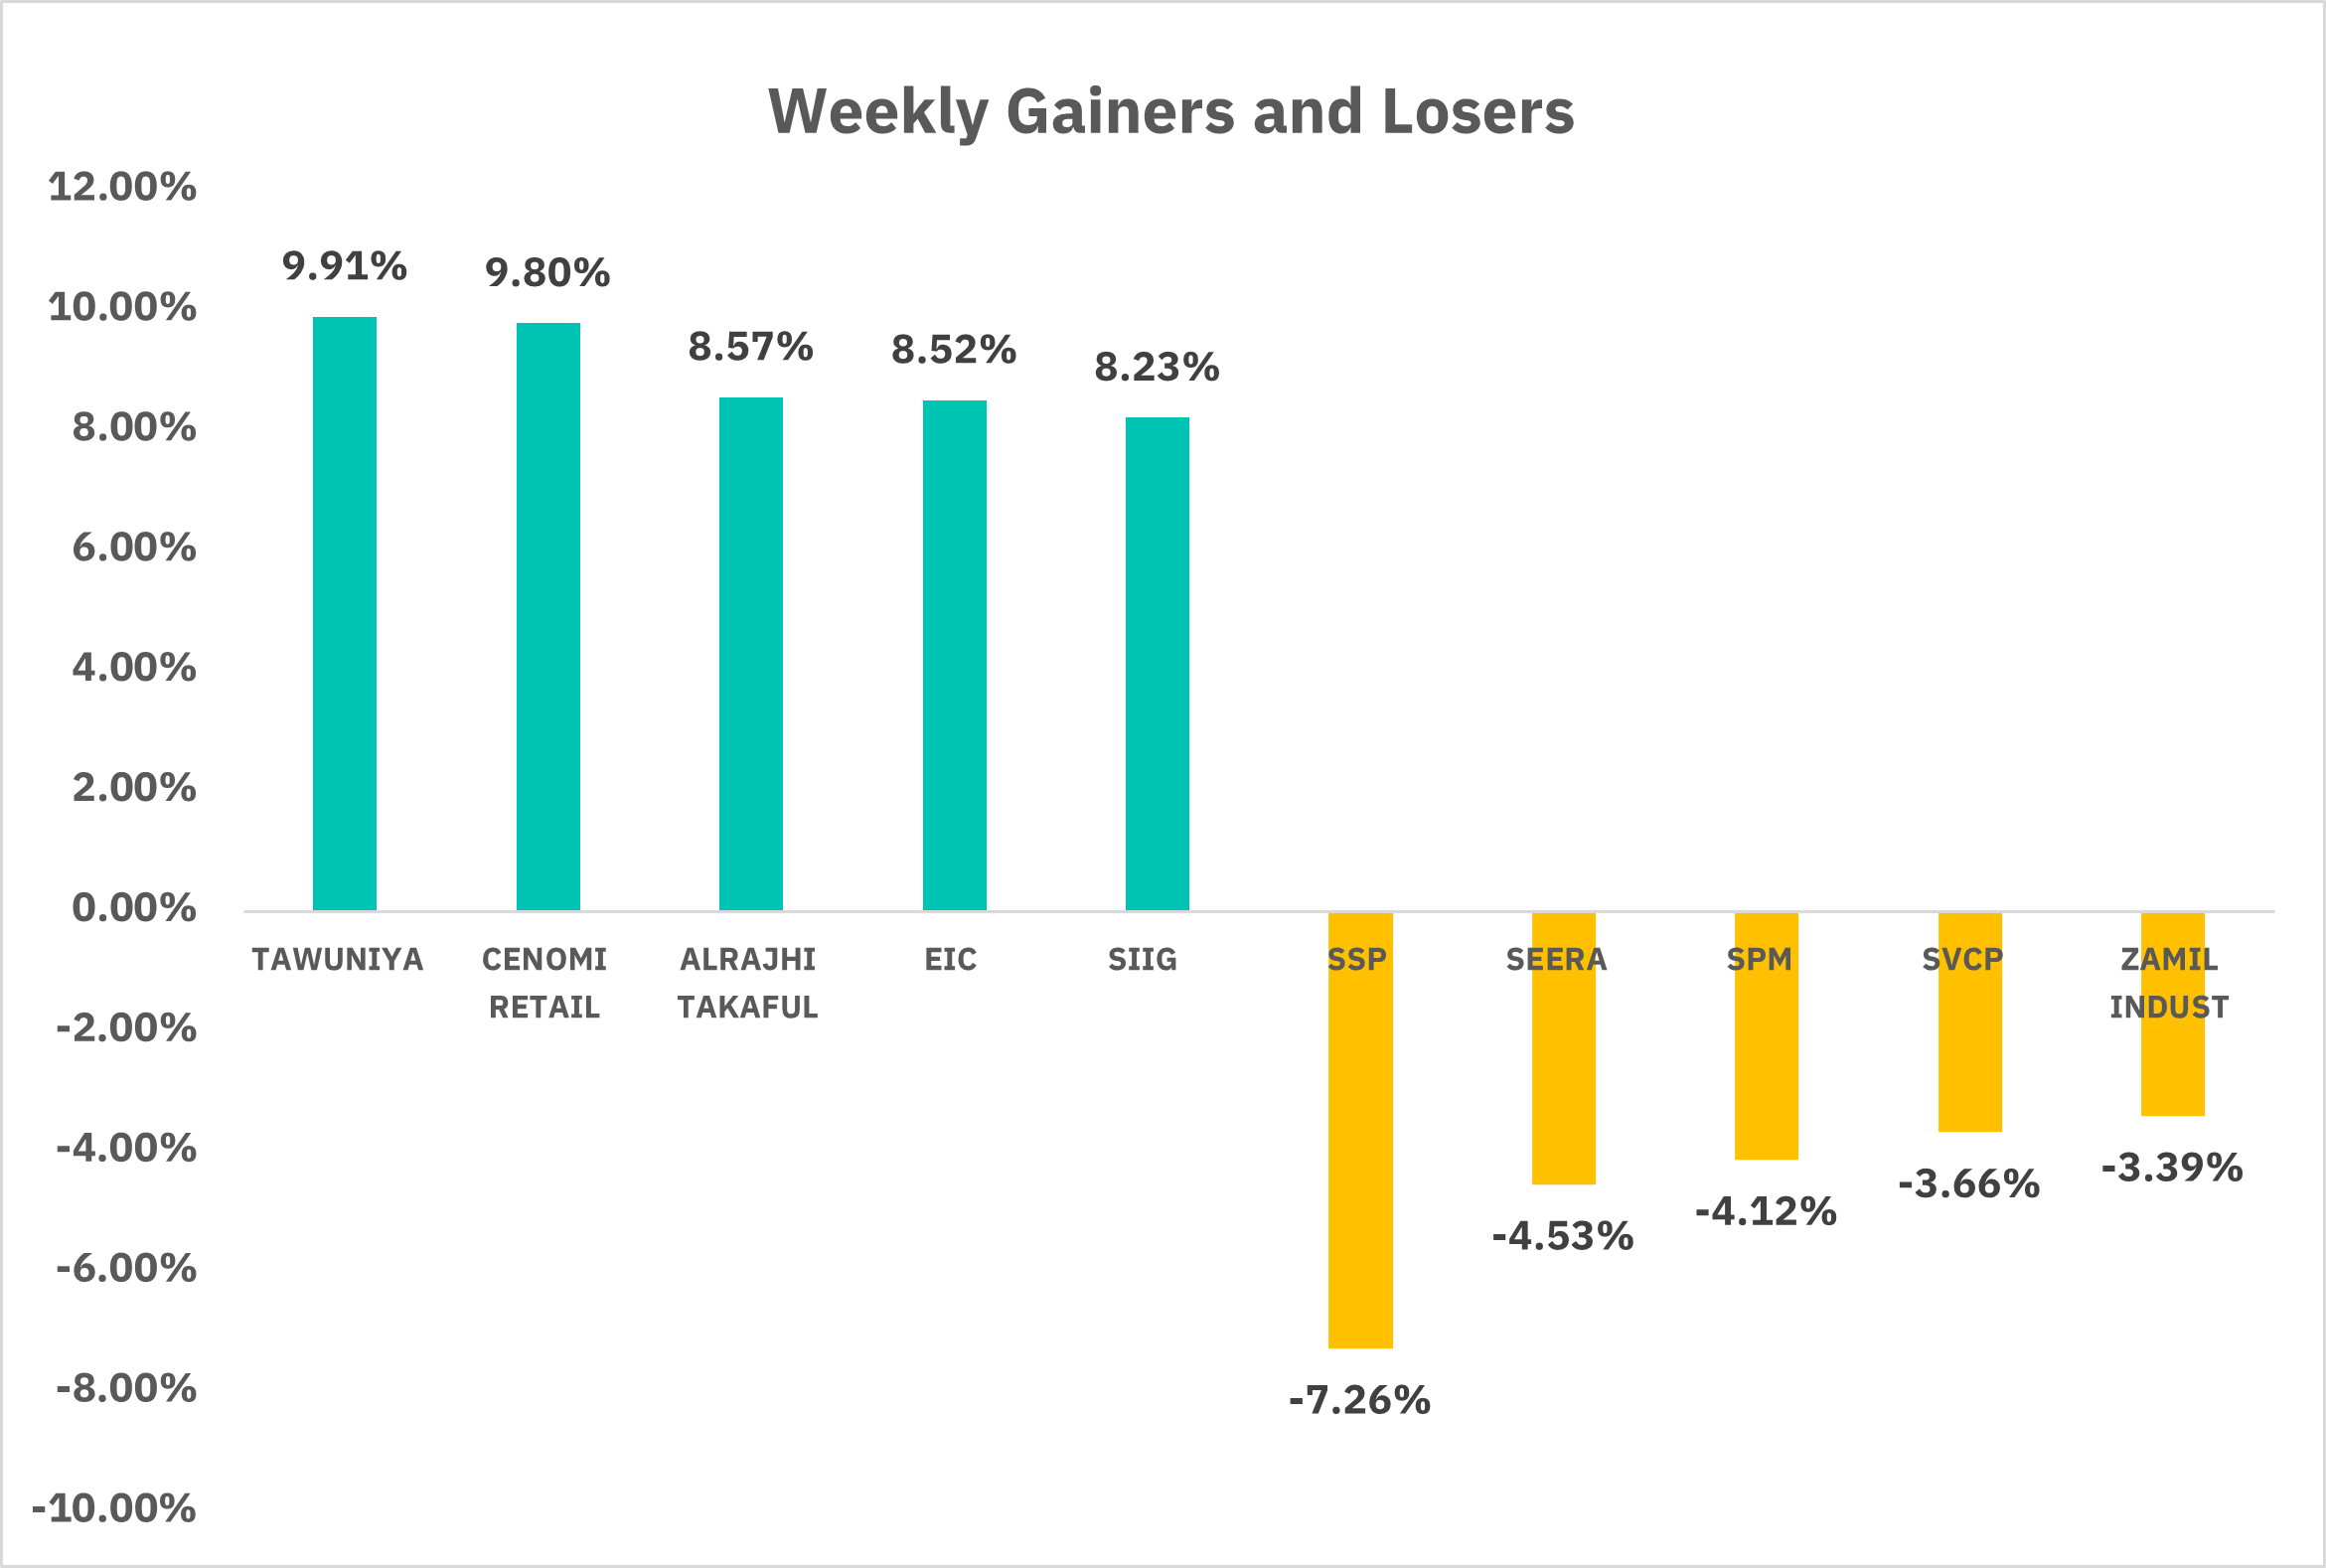
From the perspective of individual stock performance, 185 companies saw their stock prices rise this week, while 75 companies saw their stock prices fall. The companies with the highest increase included TAWUNIYA, CENOMI RETAIL, ALRAJHI TAKAFUL, with increases of 9.91%, 9.80% , and 8.57% respectively. The companies with the highest decline included SSP, SEERA, SPM, with declines of 7.26%, 4.53%, and 4.12% respectively.
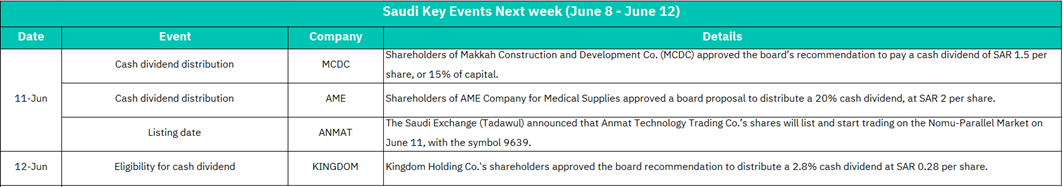
June 11
- MCDC: Distribution of 15% cash dividend (SAR 1.5/share).
High yield may trigger short-term demand for construction sector stocks.
Post-dividend price correction likely; monitor trading volume for sentiment shifts.
- AME: Distribution of 20% cash dividend (SAR 2/share).
Exceptional yield (20%) could drive aggressive buying in healthcare supplies sector.
Sustainability concerns if dividend exceeds earnings growth; may attract speculative flows.
- ANMAT Listing: Annat Technology Trading Co. debuts on Nomu-Parallel Market (Symbol: 9639).
New tech exposure may attract retail/growth investors, boosting Nomu market liquidity.
Typical for new listings; limited impact on Tadawul main index but signals tech sector appetite.
June 12
KINGDOM: Eligibility for 2.8% dividend (SAR 0.28/share).
Reinforces Kingdom Holding’s reliable shareholder returns; neutral sentiment as approval was expected.
Confirms cautious capital allocation in diversified holdings amid market uncertainty.
U.S. Market
S&P500 Technical Analysis:
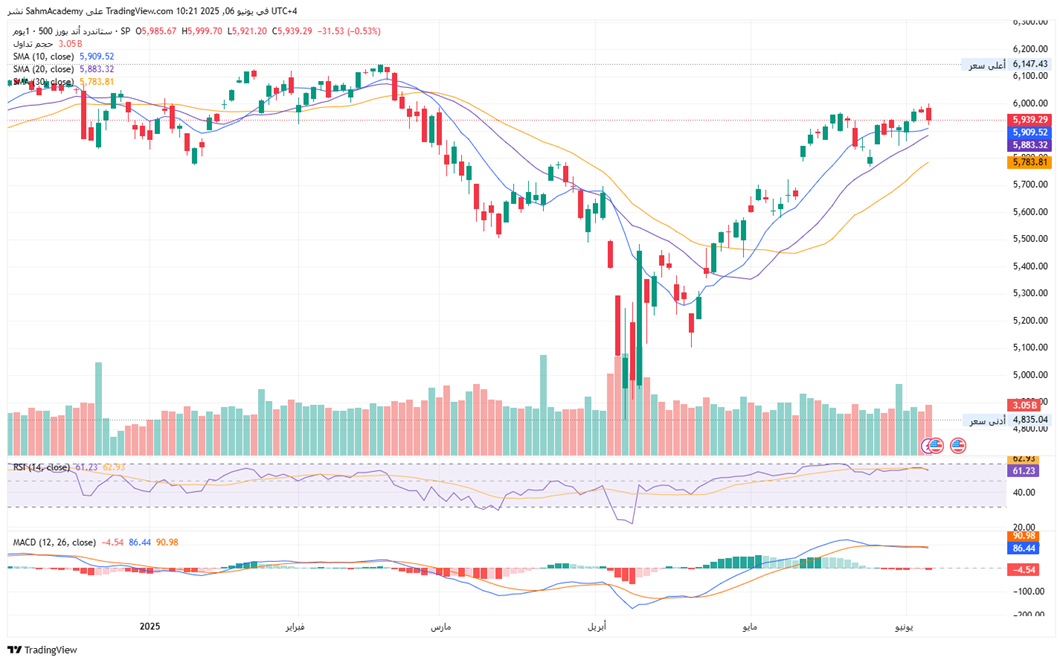
The S&P 500 maintains a structurally increased bias at 5,939.29, trading above all critical moving averages (10/20/30-day SMAs) which now form a convergent support ladder (5,909 → 5,883 → 5,788). Active bull flag consolidation near 5,900-6,000, projecting a measured move to 6,100-6,200 upon resolution; Momentum Confirmation: RSI (61.23) holds bullish equilibrium (50+ without overbought pressure), while MACD’s positive histogram signals sustained upside impulse;
Violation of 5,883 (20-SMA) would threaten near-term structure, with a close below 5,788 (30-SMA) necessitating trend reassessment.
Bull flag resolution targets 6,050-6,100 in immediate term, extending to 6,150-6,200 on volume-backed breakout. Failure below 5,883 invalidates pattern, exposing 5,750-5,800 consolidation support.
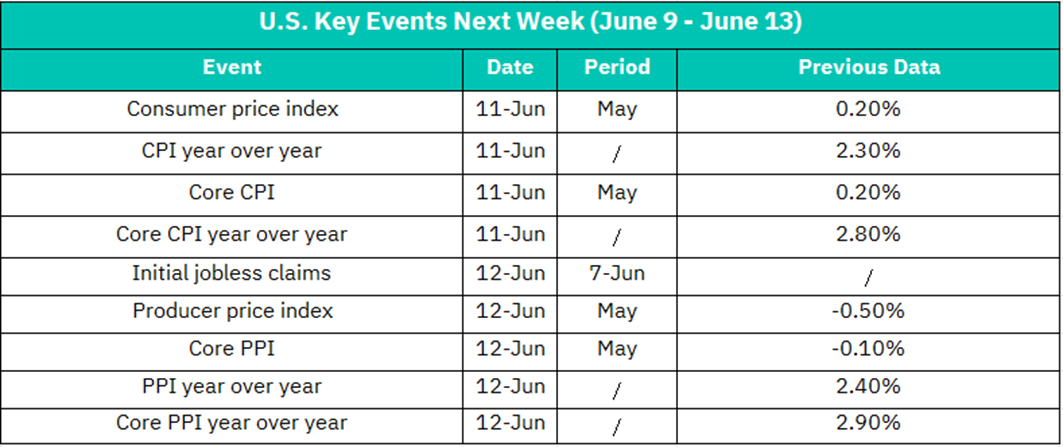
June 11
-Consumer Price Index (CPI) MoM (May)
Previous: 0.20%
A reading >0.3% could reignite Fed rate hike fears, pressuring equities (especially tech/growth stocks). A <0.1% print may boost rate-cut hopes, lifting markets.
-CPI YoY & Core CPI (May)
Previous: 2.30% (Headline YoY), 2.80% (Core YoY)
Core YoY >2.8%: Bond yields surge, equities sell off (defensive sectors outperform).
Core YoY ≤2.7%: Rally in rate-sensitive stocks (tech, real estate).
June 12
-Producer Price Index (PPI) MoM & YoY (May)
Previous: -0.50% (MoM), 2.40% (YoY)
PPI Rebound (e.g., >0%): Signals rising input costs, amplifying CPI-driven volatility.
Weak PPI (e.g., <-0.3%): Eases inflation concerns, supporting equities.
-Core PPI (MoM/YoY)
Previous: -0.10% (MoM), 2.90% (YoY)
Sustained core PPI weakness (<0%) could offset CPI anxieties, boosting cyclical stocks.
-Initial Jobless Claims (Week of June 7)
Claims >235K: Stagflation fears, broad market pressure.
Claims <210K: Reinforces labor resilience, favoring industrials/consumer discretionary.
Crypto ETF Technical Analysis:
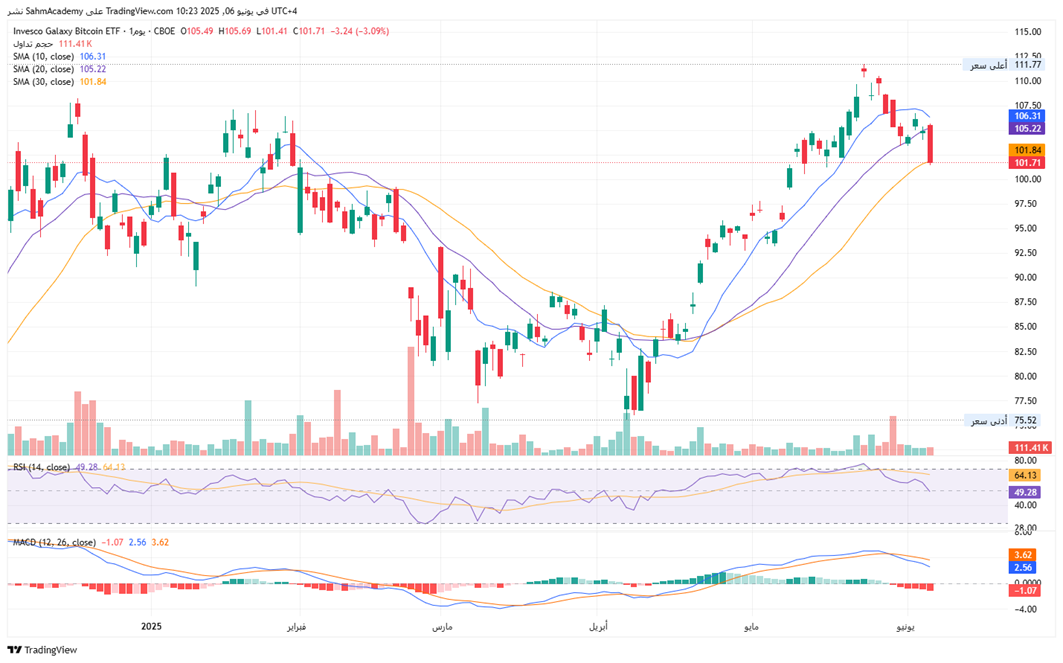
BTCO (Bitcoin ETF) is trading at $101.71, testing critical support at the 30-day SMA ($101.84) amid a deteriorating technical structure. Price trades below all key SMAs (10/20/30-day), dynamic resistance now layered at $105.22–106.31.MACD histogram expansion and signal line crossover signal intensifying downside impulse, while RSI (49.28) breaking below 50 neutral zone reflects weakening momentum.
Formation of a potential head-and-shoulders top (head: $111.77, neckline: $101–102), with a confirmed close below $101.84 triggering measured move targets to $95–97 (immediate) and $85–88 (structural). Elevated volume on declines confirms distribution pressure, while anemic bounce volumes indicate lack of buyer conviction. Correlated Bitcoin weakness and institutional outflows amplify downside risks.
Disclaimer:
Sahm is subject to the supervision and control of the CMA, pursuant to its license no. 22251-25 issued by CMA.
The Information presented above is for information purposes only, which shall not be intended as and does not constitute an offer to sell or solicitation for an offer to buy any securities or financial instrument or any advice or recommendation with respect to such securities or other financial instruments or investments. When making a decision about your investments, you should seek the advice of a professional financial adviser and carefully consider whether such investments are suitable for you in light of your own experience, financial position and investment objectives. The firm and its analysts do not have any material interests or conflicts of interest in any companies mentioned in this report.
Performance data provided is accurate and sourced from reliable platforms, including Argaam, TradingView, MarketWatch.
IN NO EVENT SHALL SAHM CAPITAL FINANCIAL COMPANY BE LIABLE FOR ANY DAMAGES, LOSSES OR LIABILITIES INCLUDING WITHOUT LIMITATION, DIRECT OR INDIRECT, SPECIAL, INCIDENTAL, CONSEQUENTIAL DAMAGES, LOSSES OR LIABILITIES, IN CONNECTION WITH YOUR RELIANCE ON OR USE OR INABILITY TO USE THE INFORMATION PRESENTED ABOVE, EVEN IF YOU ADVISE US OF THE POSSIBILITY OF SUCH DAMAGES, LOSSES OR EXPENSES.
