2024's Top US Stocks by Buffett's Favourite Indicator - In Which Tesla Ranks Only the 19th!
UnitedHealth Group Incorporated UNH | 273.67 | +1.14% |
Tesla Motors, Inc. TSLA | 381.48 | +2.62% |
Broadcom Limited AVGO | 313.50 | +1.29% |
Berkshire Hathaway Inc. Class A BRK.A | 720210.12 | +0.29% |
Exxon Mobil Corporation XOM | 162.08 | -4.47% |
If I could only pick one indicator for stock selection, it would undoubtedly be ROE.
-- Warren Buffett
Legendary businessman, investor, philanthropist, chair and CEO of Berkshire Hathaway.
In his "Letters to Shareholders"
Buffett's Favourite Gauge
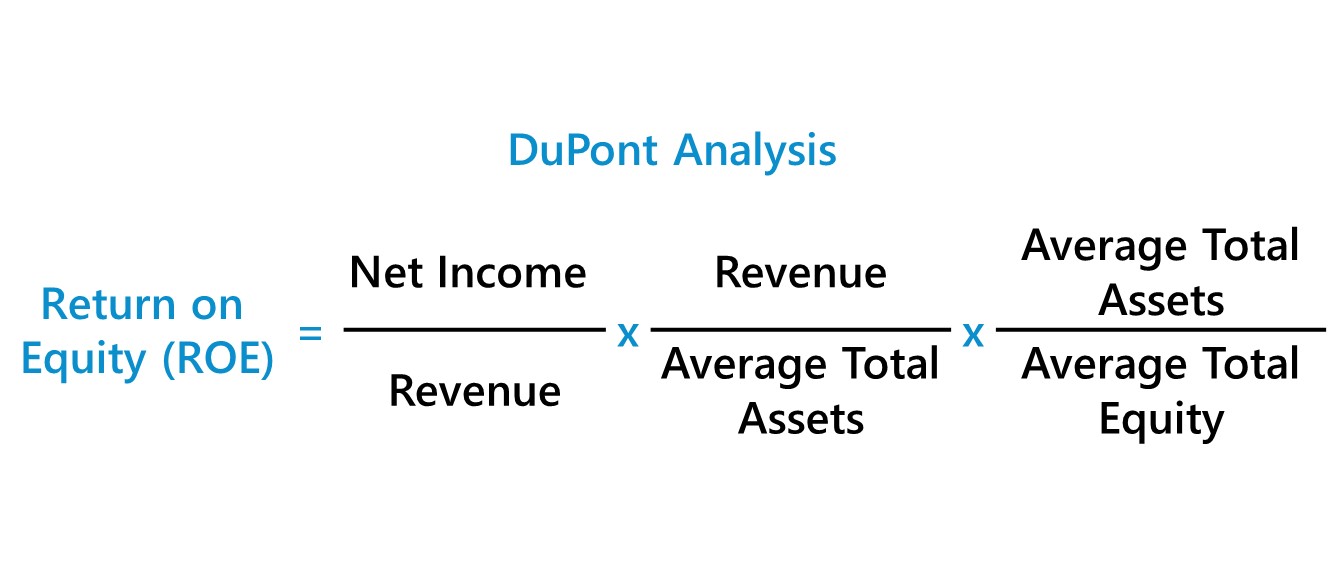
Return on Equity (ROE) is considered one of Warren Buffett's favourite financial metrics for several reasons.
ROE's components are Net Profit Margin, Assets Turnover and Equity Multiplier.
- Net Profit Margin (Net Income / Revenue) shows how good of control a company has over its costs.
- Assets Turnover (Revenue / Total Assets) shows how efficiently a company uses its assets to generate revenue, or in other words, the advantage in terms of selling goods or services.
- Equity Multiplier (Total Assets / Shareholders' Equity) reflects the degree of financial leverage - how many resources have been leveraged by the company in its development.
It is a strong indicator that allows for easier comparison between companies, regardless of their industry or size. It standardizes profitability by putting it in the context of equity, making it possible to compare different companies on a level playing field.
Buffett prefers companies with a stable and high ROE over a long period. Generally, a higher ROE indicates a more efficient company in terms of generating profits relative to its equity. However, an extremely high ROE might also be a sign of high leverage (using debt to finance growth), which carries its risks.
With this powerful stock analysis tool, we are here to examine 2024's best US stock results and discover how these companies became the most valuable companies today.
Here's the ranking.
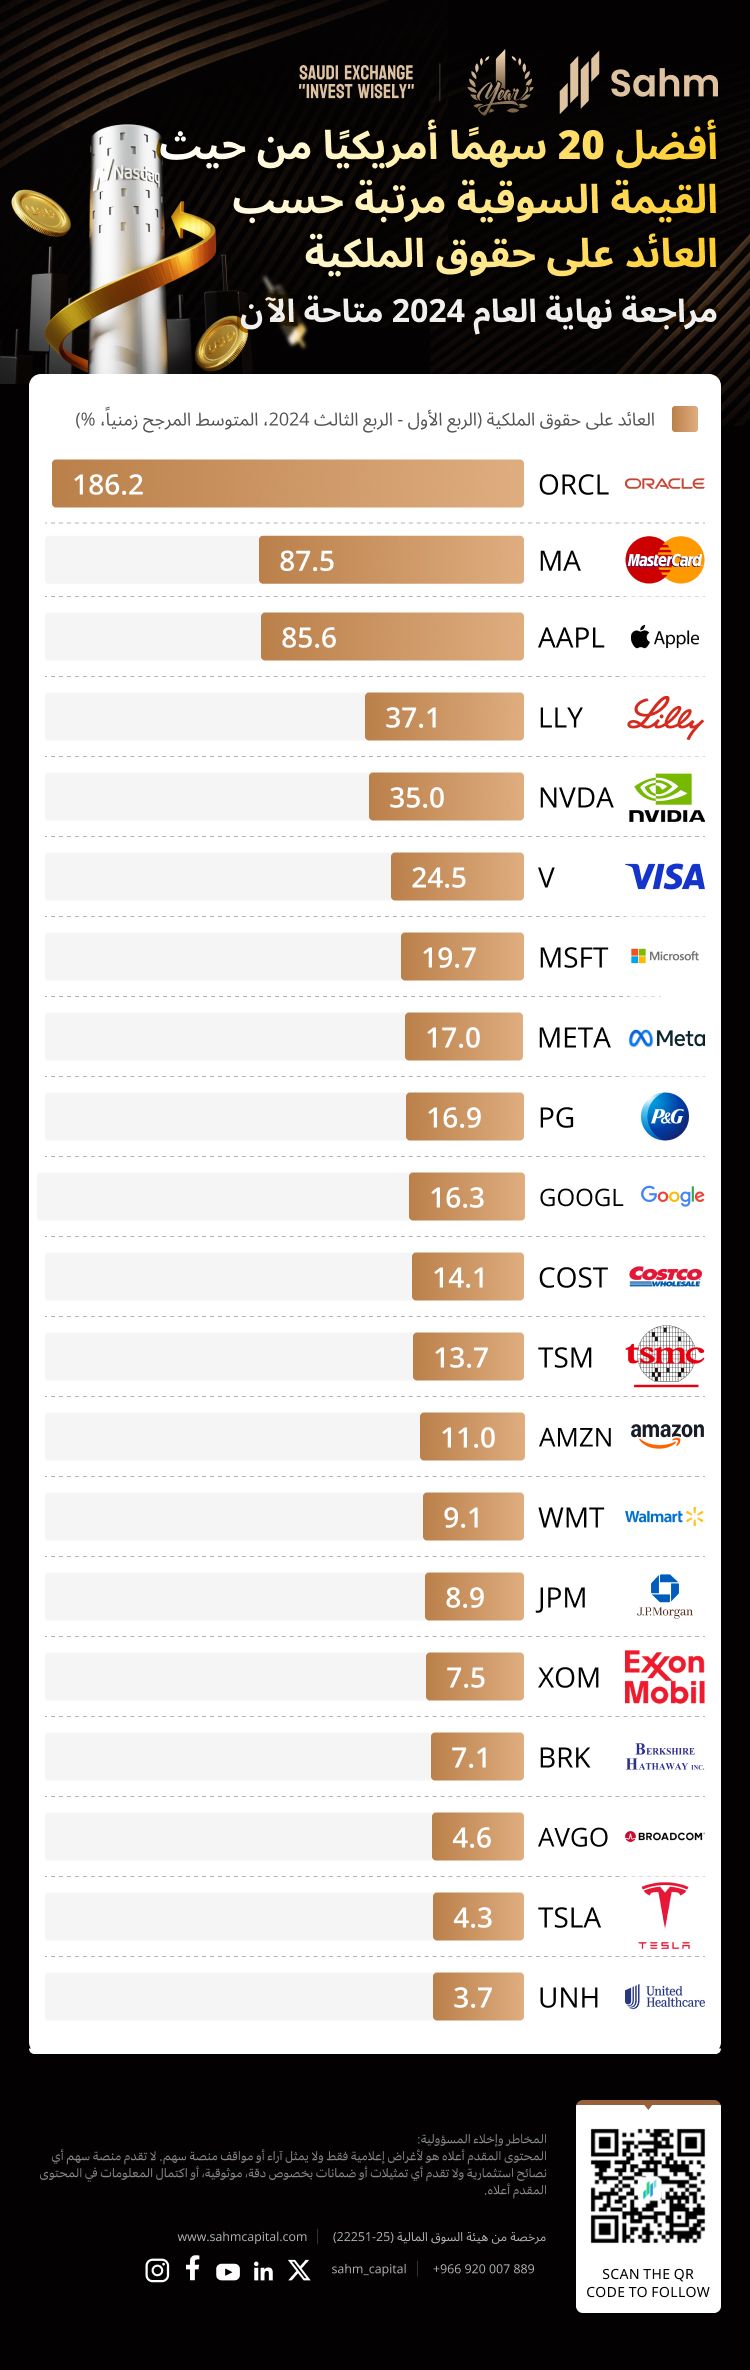
(Note: Considering the growth and stability over a longer period, we give up using the ROE of the latest reporting period as the ranking criterion and instead average the ROE of 2024Q1-Q3. We will list both ROE digits at the bottom of each company's charts.)
No.20
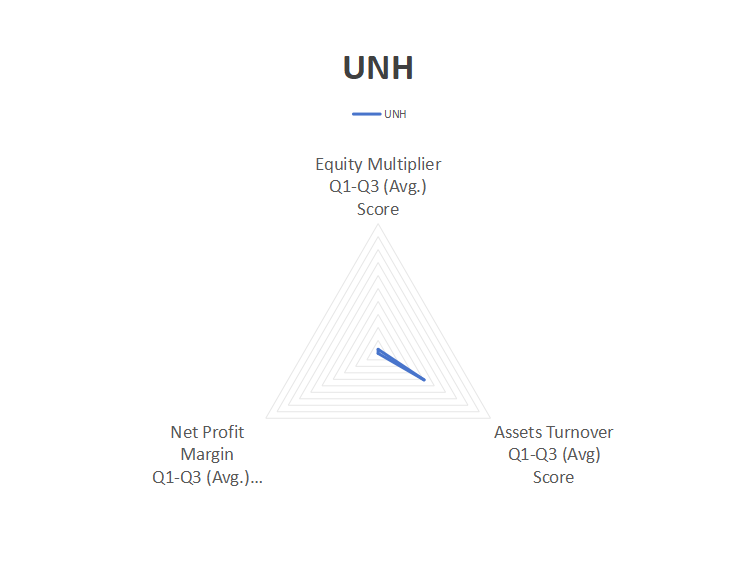
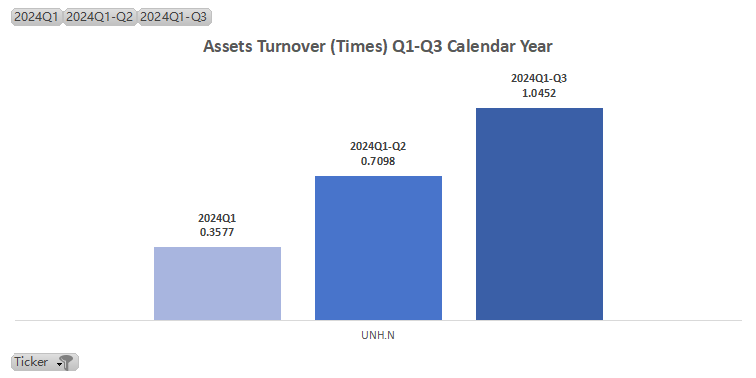
UnitedHealth Group Incorporated(UNH.US)
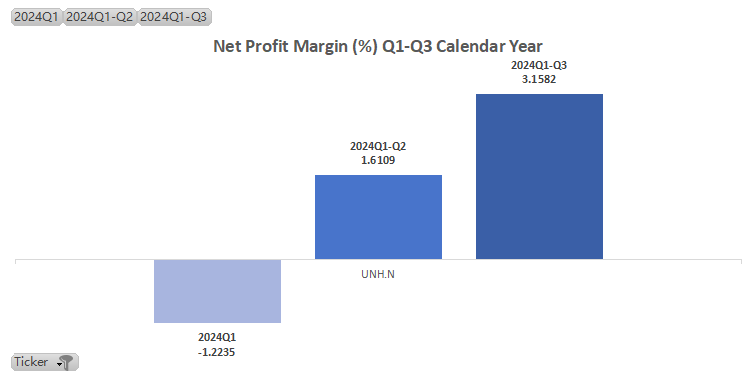
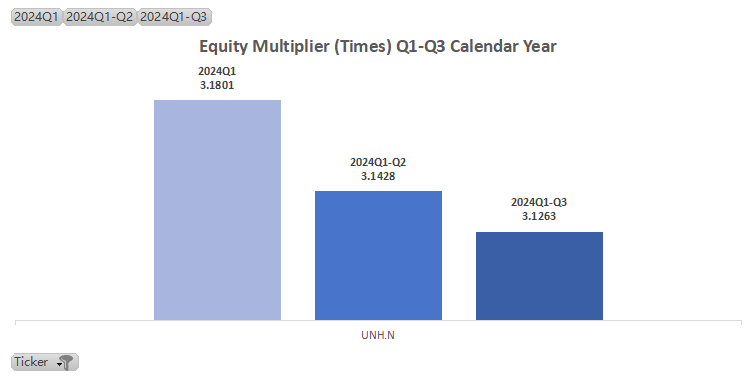
| Ticker | UNH.N |
| ROE Q1-Q3 (Avg.) | 3.74 |
| ROE Q3 | 9.6699 |
| Assets Turnover Q1-Q3 (Avg.) [KEY FACTOR] | 0.70 |
| Net Profit Margin Q1-Q3 (Avg.) | 1.18% |
| Equity Multiplier Q1-Q3 (Avg.) | 3.15 |
UNH Performance in 2024:
In 2024, UnitedHealth Group Incorporated(UNH.US) experienced frequent stock price target adjustments, reflecting market optimism about its future performance.
Despite strong revenue growth in Q3, an unexpectedly higher medical loss ratio (MLR) put pressure on its stock, potentially affecting adjusted EPS by 3-8%.
Policy changes, particularly in coverage for multi-gene tests, posed additional challenges. Institutional investors showed mixed positions on the stock, with some increasing and others decreasing their holdings.
No.19
Tesla Motors, Inc.(TSLA.US)
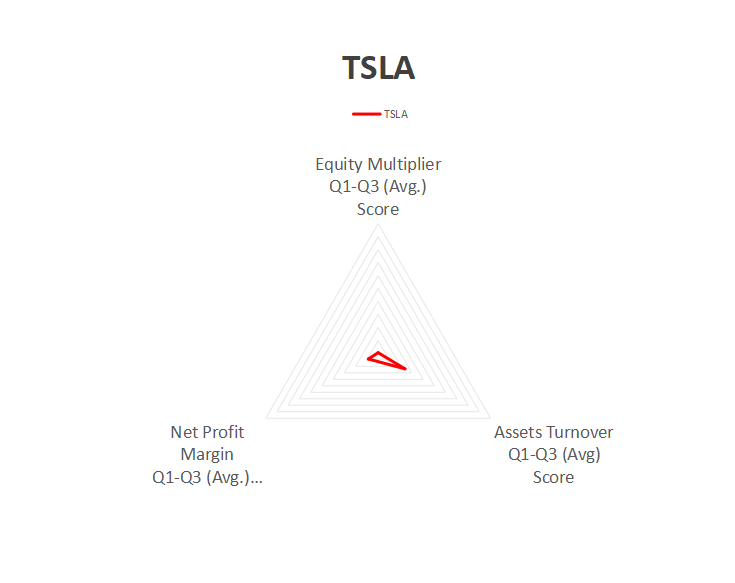

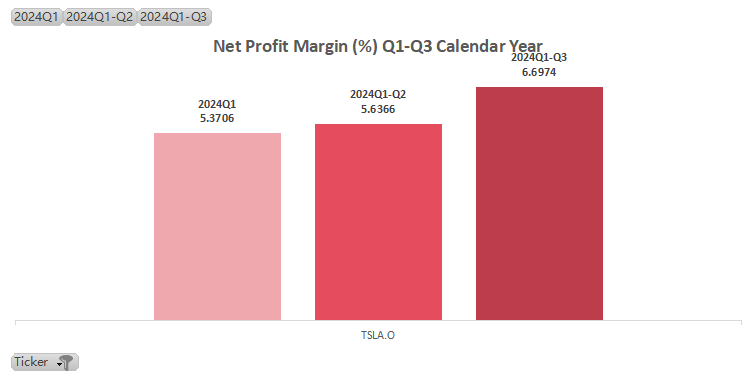
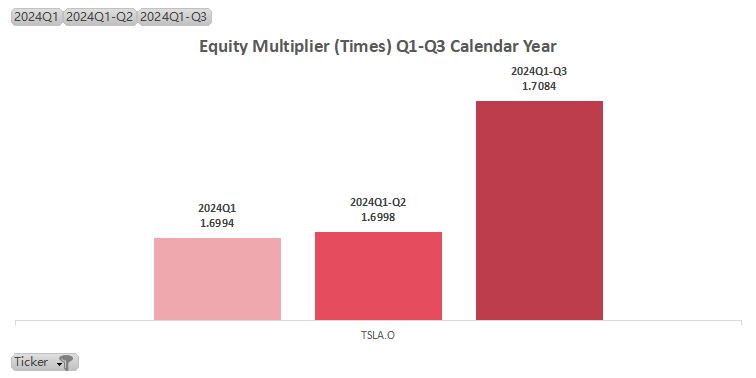
| Ticker | TSLA.O |
| ROE Q1-Q3 (Avg.) | 4.34 |
| ROE Q3 | 7.2025 |
| Assets Turnover Q1-Q3 (Avg.) [KEY FACTOR] | 0.42 |
| Net Profit Margin Q1-Q3 (Avg.) | 5.90% |
| Equity Multiplier Q1-Q3 (Avg.) | 1.70 |
TSLA Performance in 2024:
In 2024, Tesla Motors, Inc.(TSLA.US)'s stock price showed significant fluctuations, rising from a low of US$138.80 to a high of US$462.28, driven by market optimism and key announcements such as increased production capacity for the new Model Y, progress in building its Shanghai energy storage Gigafactory, and year-end promotions.
However, challenges included a massive recall due to a TPMS defect and strong competition from BYD COMPANY LIMITED(BYDDY.US), which surpassed Tesla in Q3 revenue. Despite a slight shortfall in Q3 revenue expectations, Tesla's net profit exceeded forecasts, leading analysts to raise target prices.
Prospects remain positive, with growth in autonomous driving and energy storage sectors bolstering market confidence. Tesla CEO Elon Musk was appointed as head of the US Department of Government Efficiency by Donald Trump.
No.18
Broadcom Limited(AVGO.US)
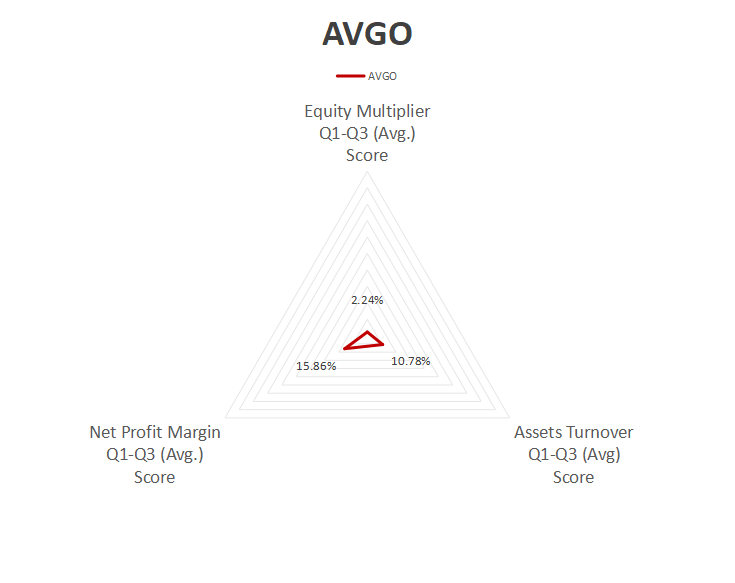

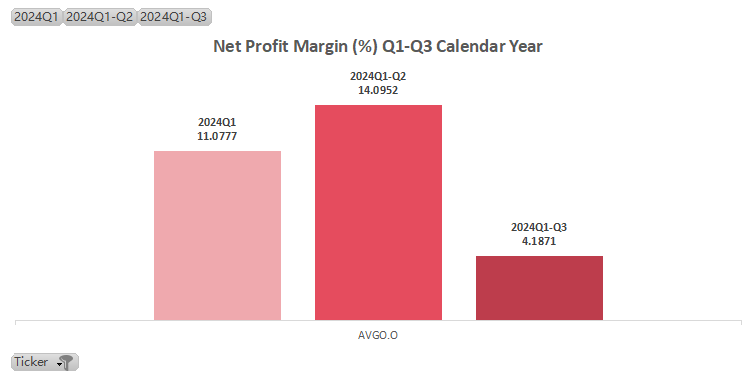
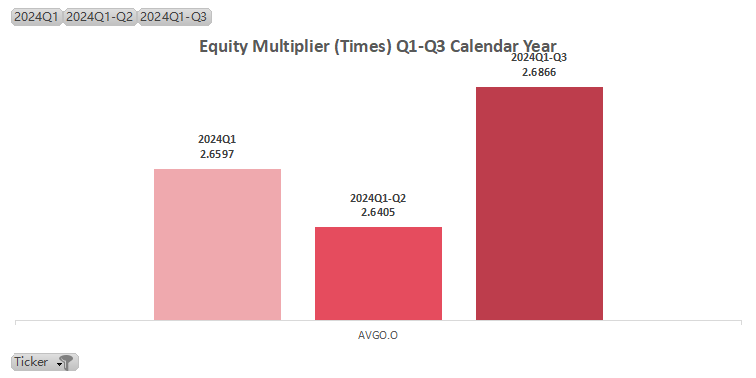
| Ticker | AVGO.O |
| ROE Q1-Q3 (Avg.) | 4.55 |
| ROE Q3 | 3.5052 |
| Assets Turnover Q1-Q3 (Avg.) [KEY FACTOR] | 0.20 |
| Net Profit Margin Q1-Q3 (Avg.) [KEY FACTOR] | 9.79% |
| Equity Multiplier Q1-Q3 (Avg.) | 2.66 |
AVGO Performance in 2024:
In 2024, Broadcom Limited(AVGO.US)'s stock price experienced significant volatility, notably soaring by 20.3% in the fourth quarter due to robust quarterly performance, driven largely by strong AI sector results.
Analysts such as Morgan Stanley and Citigroup raised target prices substantially, reflecting market optimism. Despite mixed financial data—annual revenues rose to US$51.57 billion (up 43.99%), but shareholder profits fell by 58.14% due to non-recurring costs—AI-related revenue surged by 220% in Q4, signifying robust growth in key sectors.
AI initiatives, including advanced Ethernet chips like Tomahawk5, are pivotal, with AI revenues projected to reach US$60-90 billion by 2027.
No.17
Berkshire Hathaway Inc. Class A(BRK.A.US)
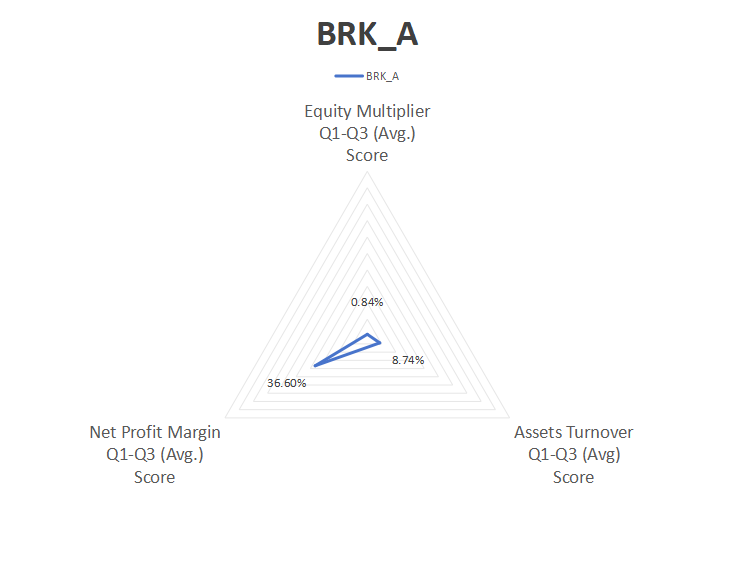
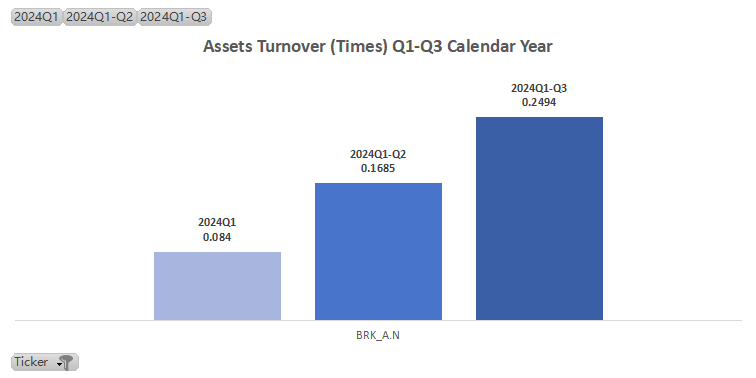
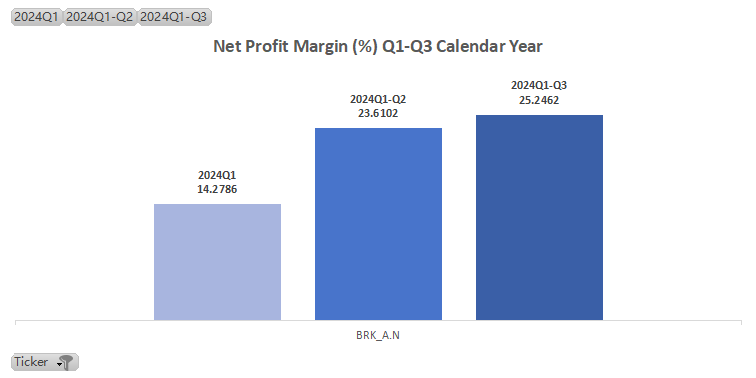
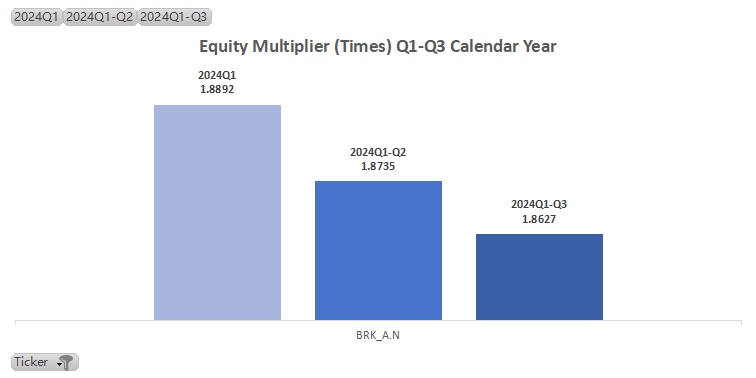
| Ticker | BRK_A.N |
| ROE Q1-Q3 (Avg.) | 7.10 |
| ROE Q3 | 11.6439 |
| Assets Turnover Q1-Q3 (Avg.) | 0.17 |
| Net Profit Margin Q1-Q3 (Avg.) [KEY FACTOR] | 21.05% |
| Equity Multiplier Q1-Q3 (Avg.) | 1.88 |
BRK.A/BRK.B Performance in 2024:
In 2024, Berkshire Hathaway Inc. Class A(BRK.A.US)'s stock had an impressive performance, with shares rising by 27%, surpassing the S&P 500. Stock prices exceeded US$700,000, marking the best performance since 2021.
The company strategically reduced its holdings in Apple Inc.(AAPL.US) and Bank of America Corporation(BAC.US), significantly increasing its cash reserves to a record US$325.2 billion by Q3 2024.
Despite strong financial results, including a net profit of US$26.25 billion in Q3, Buffett paused stock repurchases, focusing on cash reserves for potential future investments.
However, insurance underwriting profits declined due to hurricane-related losses.
No.16
Exxon Mobil Corporation(XOM.US)
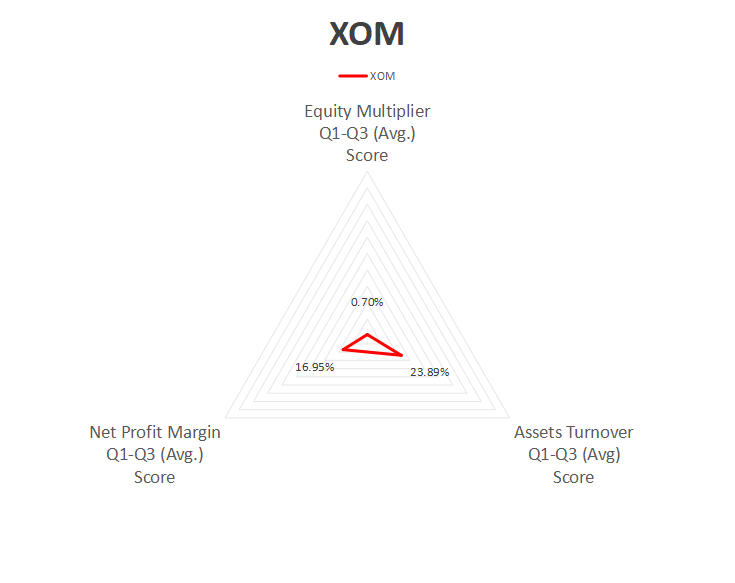

| Ticker | XOM.N |
| ROE Q1-Q3 (Avg.) | 7.47 |
| ROE Q3 | 11.0141 |
| Assets Turnover Q1-Q3 (Avg.) [KEY FACTOR] | 0.42 |
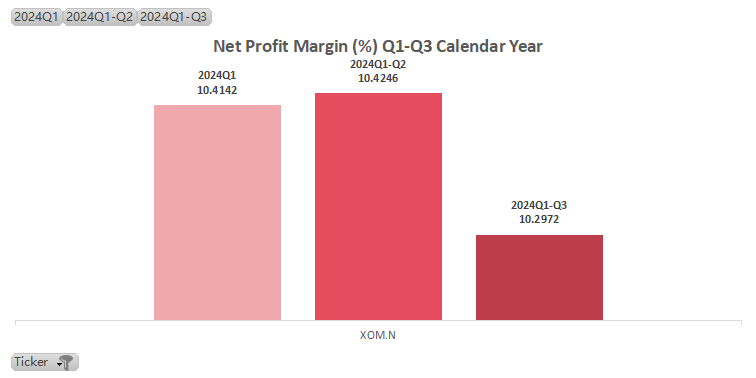
| Net Profit Margin Q1-Q3 (Avg.) | 10.38% |
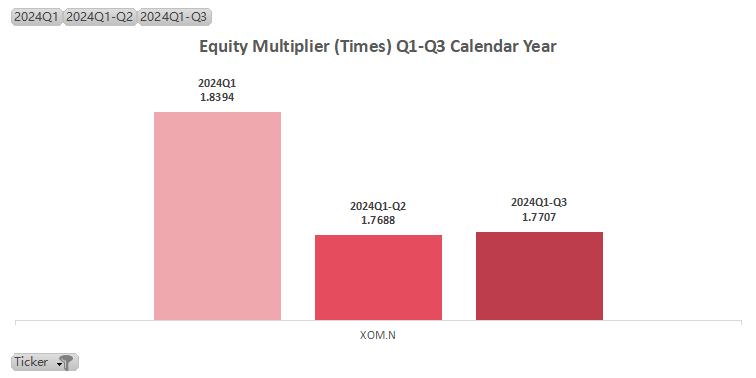
| Equity Multiplier Q1-Q3 (Avg.) | 1.79 |
XOM Performance in 2024:
In 2024, Exxon Mobil Corporation(XOM.US) experienced stock price volatility.
Following its Q3 earnings report, the stock rose by about 1% in pre-market trading and 3% the following day. Over the past three months, the stock price decreased by 0.09% but showed a 7.03% increase over the last 12 months.
Financially, Exxon Mobil's strong Q3 net profit of US$8.6 billion and EPS of US$1.92 exceeded expectations, despite slightly lower revenue than anticipated. Capital spending and shareholder returns, including US$98 billion in dividends and buybacks, bolstered investor confidence.
No.15
JPMorgan Chase & Co.(JPM.US)
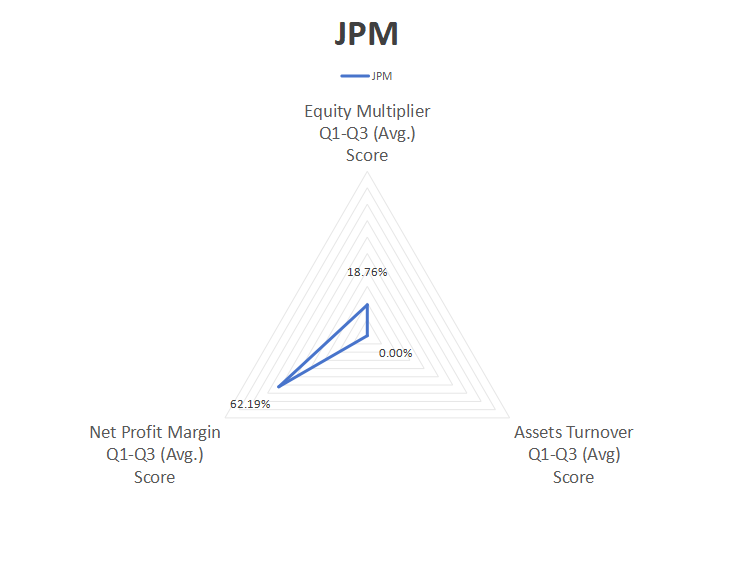
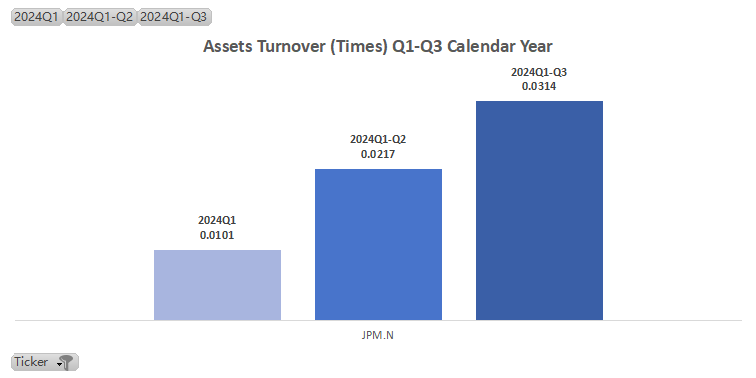
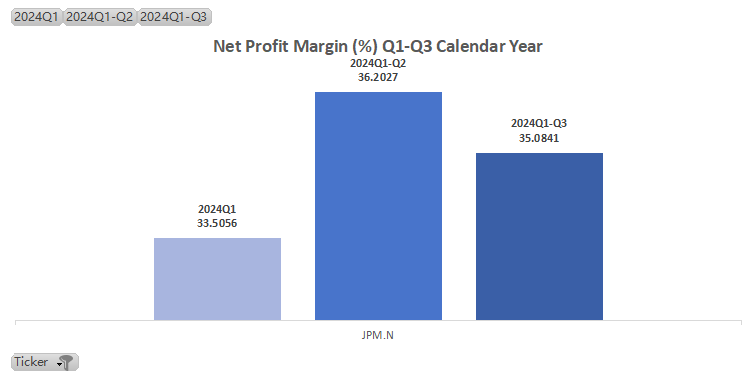
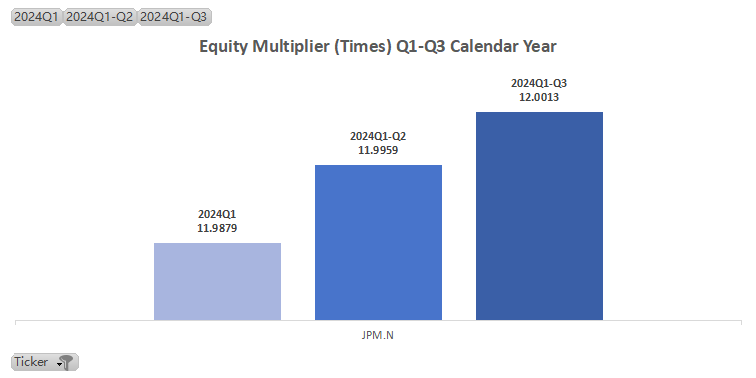
| Ticker | JPM.N |
| ROE Q1-Q3 (Avg.) | 8.89 |
| ROE Q3 | 13.2003 |
| Assets Turnover Q1-Q3 (Avg.) | 0.02 |
| Net Profit Margin Q1-Q3 (Avg.) [KEY FACTOR] | 34.93% |
| Equity Multiplier Q1-Q3 (Avg.) | 12.00 |
JPM Performance in 2024:
In 2024, JPMorgan Chase & Co.(JPM.US) exceeded market expectations with impressive stock performance.
Key growth areas included corporate investment banking (97% revenue growth), commercial banking (8% revenue growth), and asset & wealth management (8.7% revenue growth), driven by improved market conditions and strategic adjustments.
Financially, the net interest margin stood at 2.58%, the non-performing loan rate at 0.60%, and the core Tier 1 capital ratio at 15.3%. With a 19% increase in dividends to US$1.25 per share, investor confidence remained strong.
The favourable economic environment and positive revenue from ECM and DCM underpinned the stock's 15% rise by April 25, outperforming the banking index and S&P500.
No.14
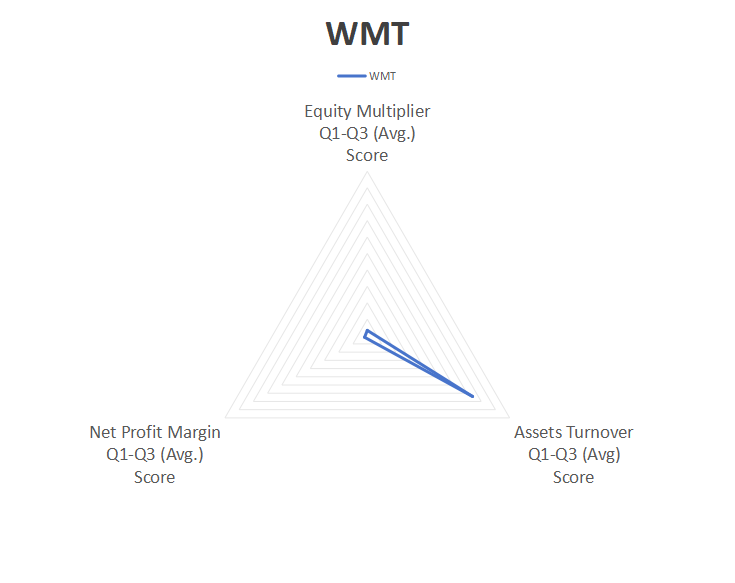
Wal-Mart Stores, Inc.(WMT.US)
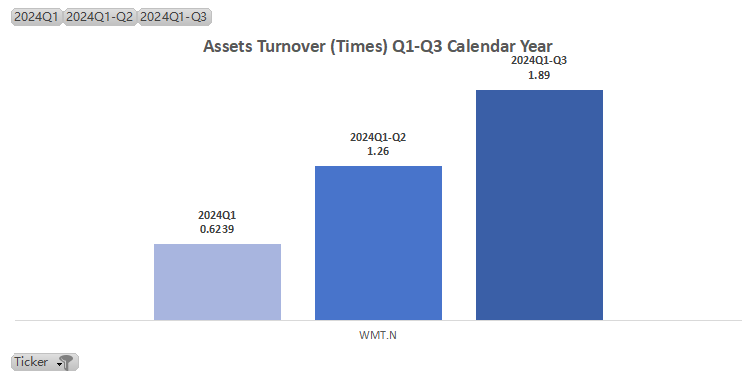
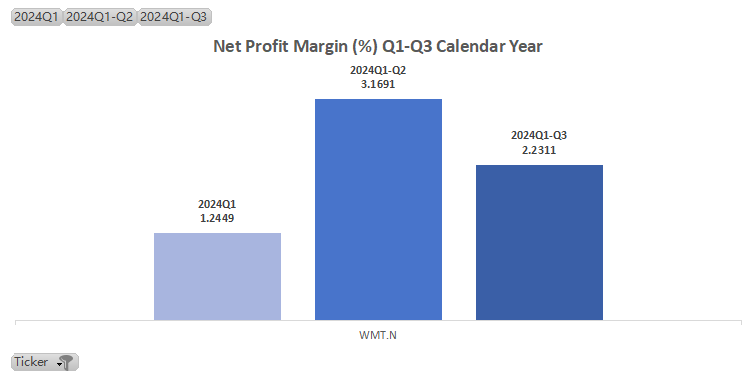
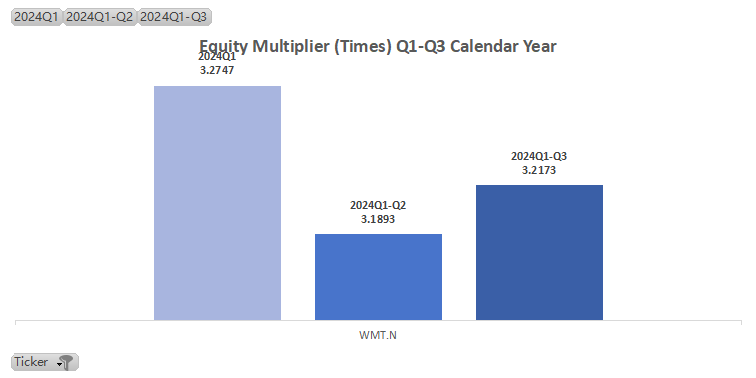
| Ticker | WMT.N |
| ROE Q1-Q3 (Avg.) | 9.11 |
| ROE Q3 | 12.8301 |
| Assets Turnover Q1-Q3 (Avg.) [KEY FACTOR] | 1.26 |
| Net Profit Margin Q1-Q3 (Avg.) | 2.22% |
| Equity Multiplier Q1-Q3 (Avg.) | 3.23 |
WMT Performance in 2024:
Wal-Mart Stores, Inc.(WMT.US)'s ROE is driven by high asset turnover and moderate financial leverage, despite low-profit margins.
In 2024, Walmart experienced a notable stock price increase of 78% by December 19, adding about US$330 billion to its market cap, outperforming peers like Dollar Tree, Inc.(DLTR.US), Dollar General Corporation(DG.US), TARGET HOSPITALITY CORP(TH.US), Amazon.com, Inc.(AMZN.US), and Costco Wholesale Corporation(COST.US).
Its strong stock performance was driven by impressive third-quarter results, with EPS of US$0.58 and revenue of US$169.59 billion, both exceeding expectations. Its success is attributed to diversification in high-margin areas like advertising and memberships, contributing about one-third of total revenue.
Analysts raised target prices, reflecting optimism about Walmart's future potential. Despite a brief 3% dip on December 24, continued robust performance could further enhance investor confidence.
No.13
Amazon.com, Inc.(AMZN.US)
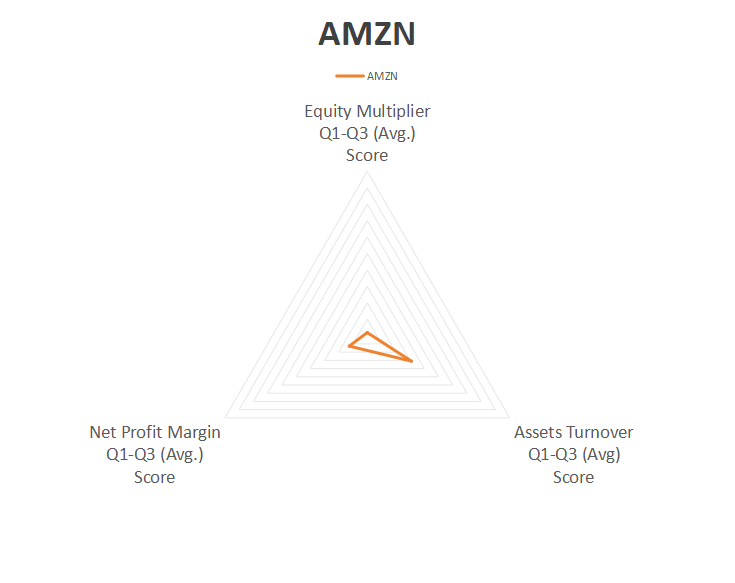
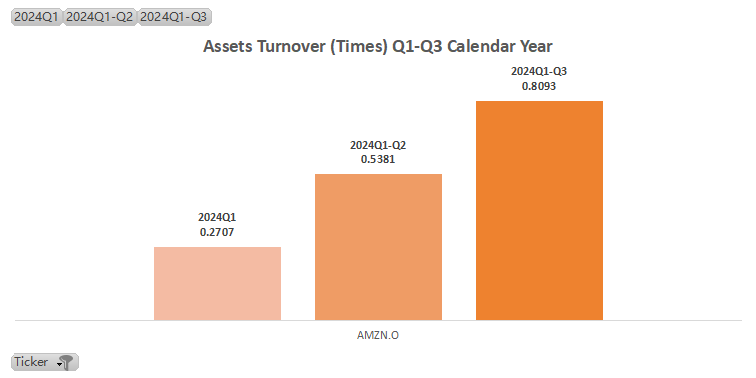
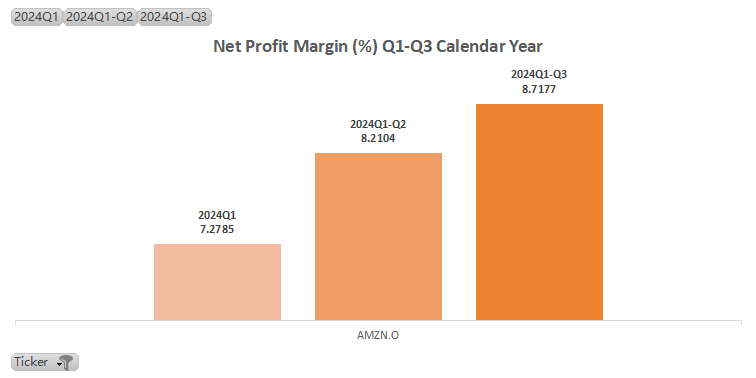
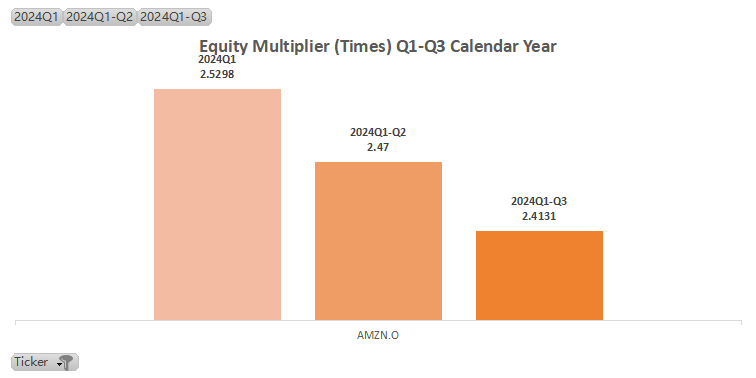
| Ticker | AMZN.O |
| ROE Q1-Q3 (Avg.) | 10.97 |
| ROE Q3 | 17.0246 |
| Assets Turnover Q1-Q3 (Avg.) [KEY FACTOR] | 0.54 |
| Net Profit Margin Q1-Q3 (Avg.) | 8.07% |
| Equity Multiplier Q1-Q3 (Avg.) | 2.47 |
AMZN Performance in 2024:
Amazon.com, Inc.(AMZN.US)'s ROE is primarily driven by high net profit margins and moderate financial leverage, while asset turnover remains modest.
In 2024, AMZN experienced significant stock price volatility, with several adjustments and gains throughout the year.
Analysts maintained positive ratings, with target prices raised by institutions like BMO Capital Markets, Tigress Financial, and UBS Group, reflecting confidence in AMZN's growth potential. AMZN's stock performance was closely tied to its strong earnings, with analysts' target price hikes boosting investor optimism.
Product and technological advancements, particularly in cloud computing and AI, further supported its stock. Despite inflation concerns, the robust performance of tech stocks and investor confidence helped AMZN reach new highs on several trading days.
No.12
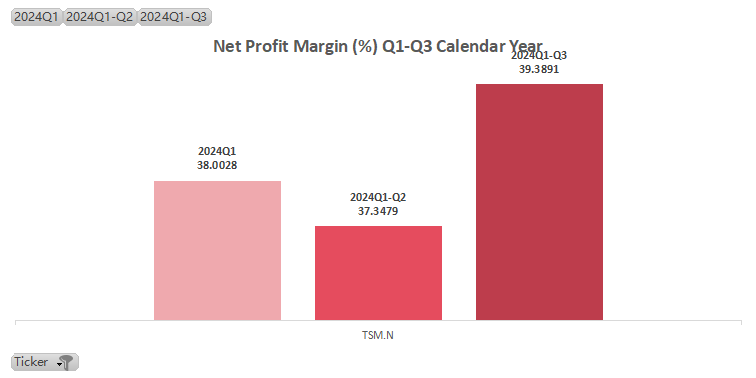
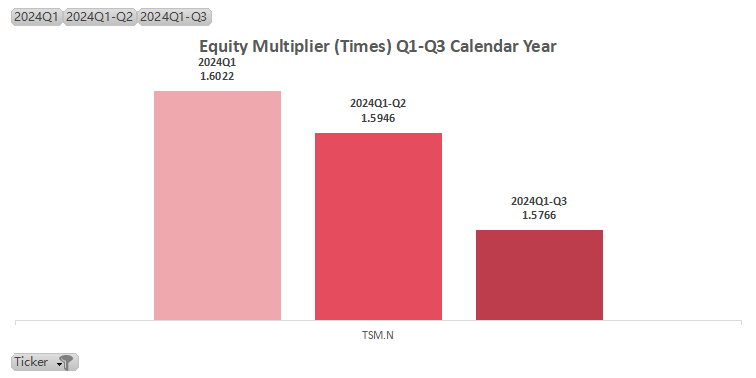
Taiwan Semiconductor Manufacturing Co., Ltd. Sponsored ADR(TSM.US)
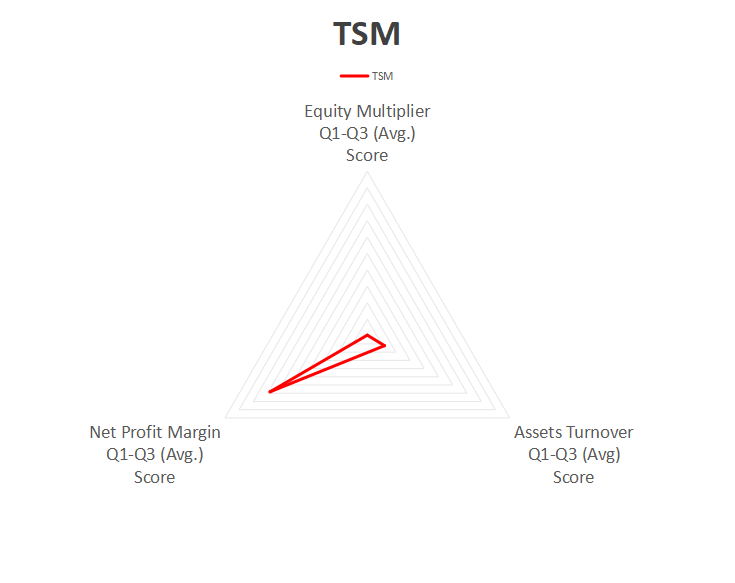
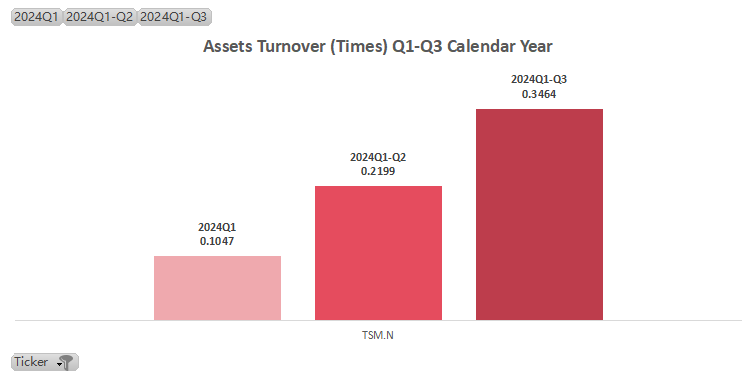
| Ticker | TSM.N |
| ROE Q1-Q3 (Avg.) | 13.67 |
| ROE Q3 | 21.5266 |
| Assets Turnover Q1-Q3 (Avg.) | 0.22 |
| Net Profit Margin Q1-Q3 (Avg.) [KEY FACTOR] | 38.25% |
| Equity Multiplier Q1-Q3 (Avg.) | 1.59 |
TSM Performance in 2024:
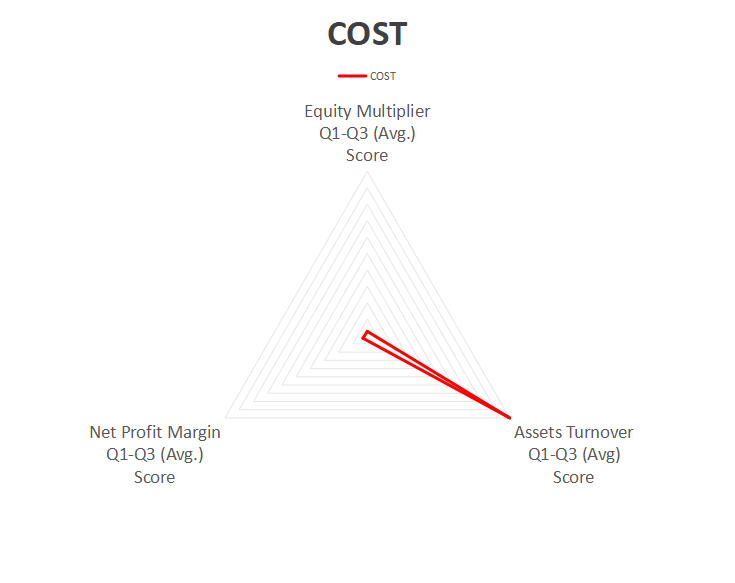
Taiwan Semiconductor Manufacturing Co., Ltd. Sponsored ADR(TSM.US)'s ROE is driven primarily by its exceptionally high net profit margin and conservative use of financial leverage, despite lower asset turnover.
In 2024, TSM had an outstanding stock performance, driven by high AI demand, with an 84% increase by December 24, marking its best year in 25 years.
The company's strong earnings were pivotal, with Q3 revenue at NT$7596.92 billion, a 38.95% YoY growth, and a net profit of NT$3252.58 billion, increasing by 54.15%. HPC, led by AI and smartphones, contributed 51% of revenue, highlighting 3nm and 5nm process demand.
Despite a competitive smartphone market, gains in AI servers boosted income.
Analysts, including Barclays and Needham, raised target prices to US$240, reflecting optimism. TSMC's advancements in 3nm and 5nm processes predict sustained growth and stock appreciation.
No.11
Costco Wholesale Corporation(COST.US)
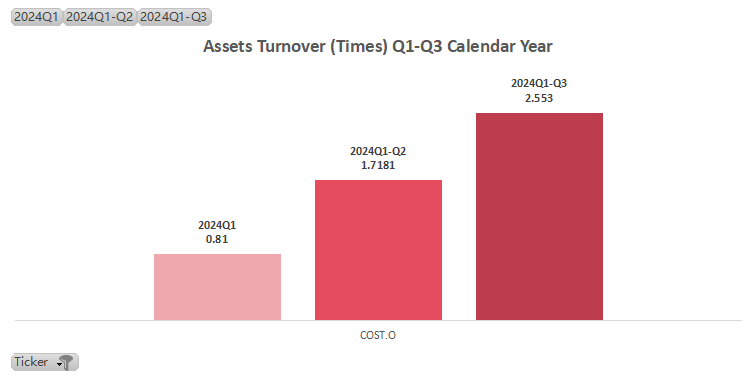

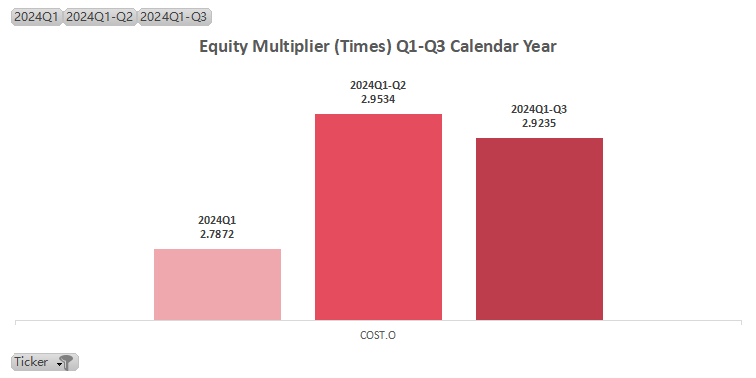
| Ticker | COST.O |
| ROE Q1-Q3 (Avg.) | 14.05 |
| ROE Q3 | 21.4098 |
| Assets Turnover Q1-Q3 (Avg.) [KEY FACTOR] | 1.69 |
| Net Profit Margin Q1-Q3 (Avg.) | 2.83% |
| Equity Multiplier Q1-Q3 (Avg.) | 2.89 |
COST Performance in 2024:
Costco Wholesale Corporation(COST.US)'s ROE is driven primarily by its high asset turnover ratio and moderate use of financial leverage, with effective cost management playing a supportive role.
In 2024, COST experienced relatively stable stock performance with notable fluctuations. Analyst ratings were optimistic, with some adjusting target prices up to US$1,060, reflecting confidence in Costco's growth potential. Financially, Costco reported US$73.67 billion in shareholder profit, a 17.09% increase, and total revenue of US$254.453 billion, up 5.02%.
Despite positive financials, stock prices showed some volatility, reaching highs of US$974.64 and US$997.96 on December 21 and 18 respectively. Analysts generally remain optimistic, with target prices as high as US$1,145, indicating expected continued growth.
No.10
Alphabet Inc. Class A(GOOGL.US)
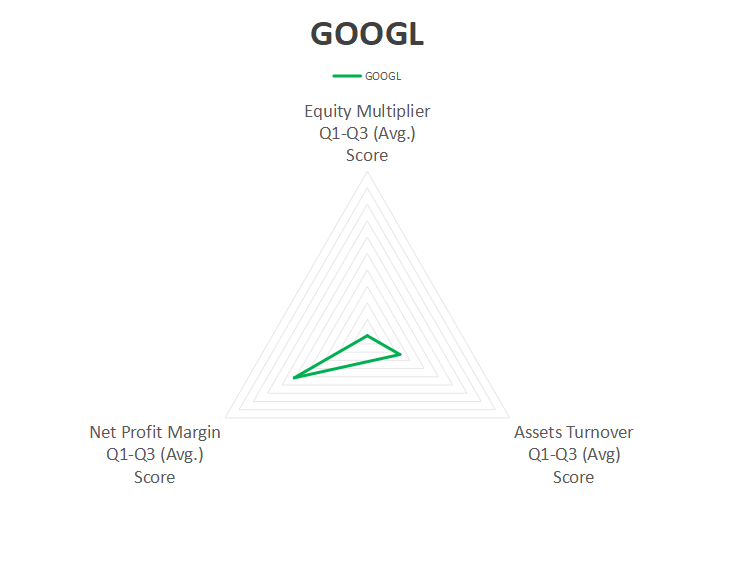
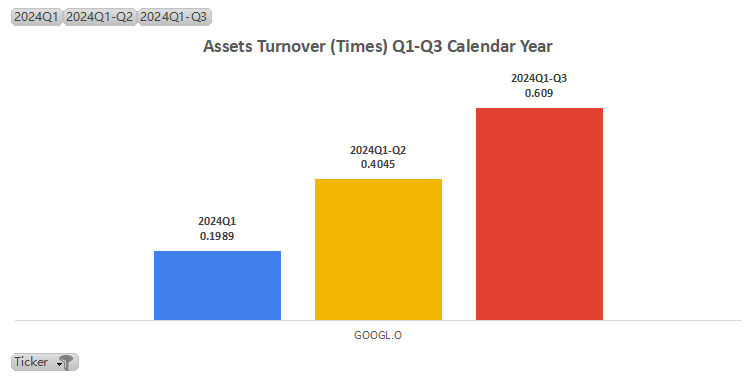
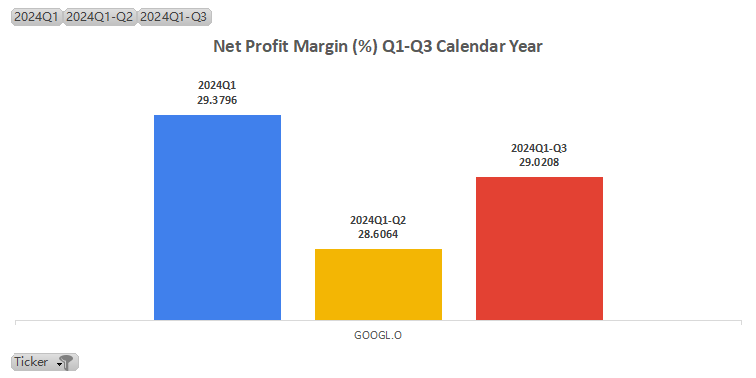
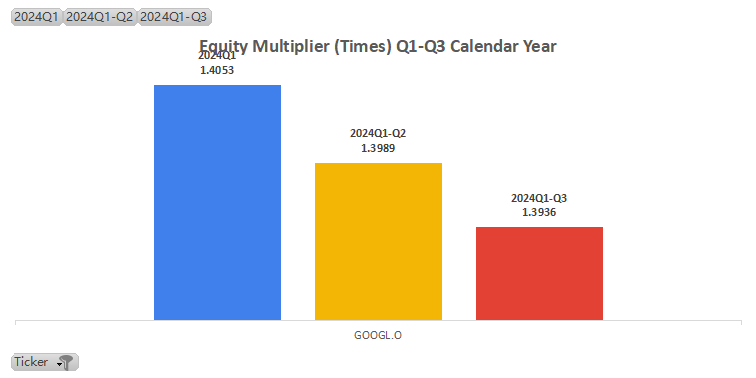
| Ticker | GOOGL.O |
| ROE Q1-Q3 (Avg.) | 16.34 |
| ROE Q3 | 24.63 |
| Assets Turnover Q1-Q3 (Avg.) | 0.40 |
| Net Profit Margin Q1-Q3 (Avg.) [KEY FACTOR] | 29.00% |
| Equity Multiplier Q1-Q3 (Avg.) | 1.40 |
GOOGL/GOOG Performance in 2024:
Alphabet Inc. Class C(GOOG.US)'s ROE is significantly driven by its high net profit margin, moderate asset turnover, and low financial leverage.
In 2024, GOOGL experienced a robust stock performance, increasing by 19.89%, attributed to solid growth in core businesses and recognition of its AI and cloud computing investments. Specifically, third-quarter net profit grew by 37%.
The advertising sector, facing stiff competition, saw a 12% revenue increase, while YouTube ads reached US$8.827 billion. Cloud revenue jumped 35% to US$10.766 billion, driven by AI advancements. Positive market reactions included a 5% stock rise on the "Willow" quantum chip launch and a 10% rise post-strong first-quarter (financial year) cloud earnings.
Analysts maintain optimism, yet caution against potential AI development, economic fluctuations, and competitive pressures.
No.9
Procter & Gamble Company(PG.US)
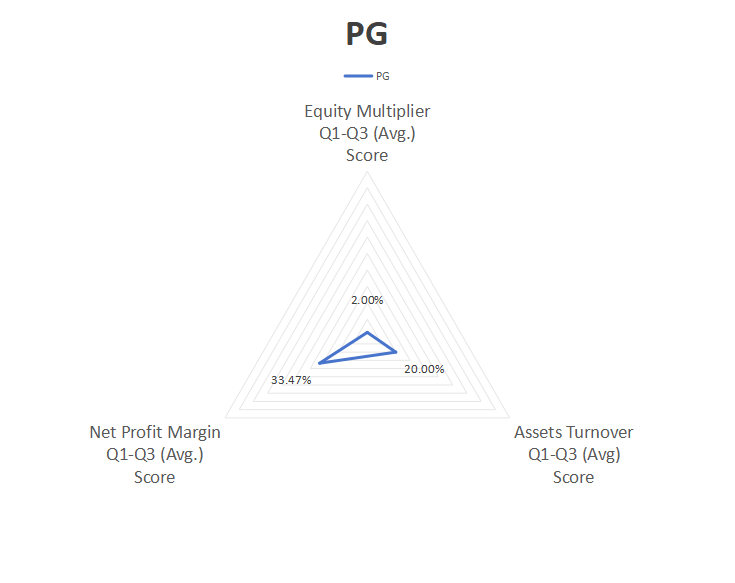
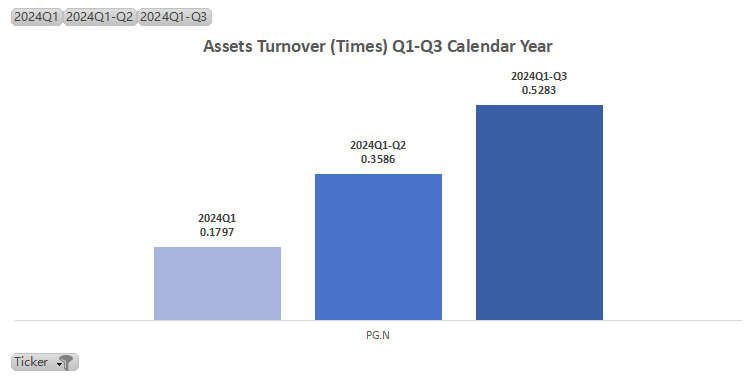
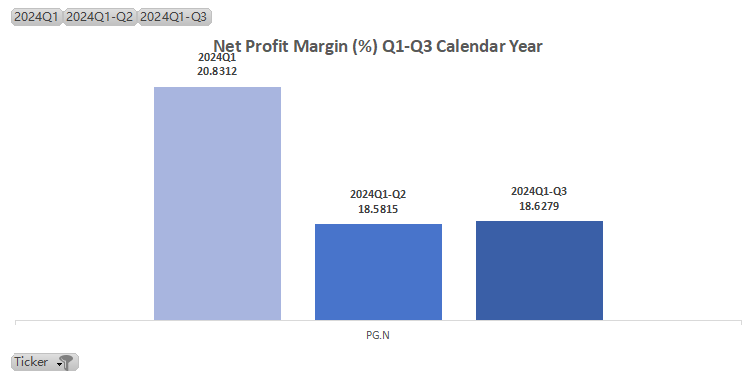
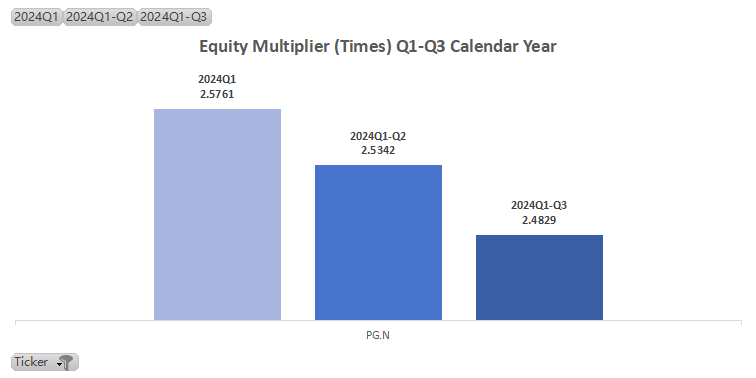
| Ticker | PG.N |
| ROE Q1-Q3 (Avg.) | 16.86 |
| ROE Q3 | 24.2516 |
| Assets Turnover Q1-Q3 (Avg.) [KEY FACTOR] | 0.36 |
| Net Profit Margin Q1-Q3 (Avg.) [KEY FACTOR] | 19.35% |
| Equity Multiplier Q1-Q3 (Avg.) | 2.53 |
PG Performance in 2024:
Procter & Gamble Company(PG.US)'s ROE is significantly driven by its high net profit margin, moderate asset turnover, and balanced financial leverage.
In 2024, PG exhibited positive stock performance, reaching a 52-week high of US$178.74 on November 15, closing at US$178.21. DA Davidson upgraded the stock to "buy" with a target of US$209, while Morgan Stanley raised it to US$191. In Q2, core net profit rose 15% and profit margins increased to 52.7%.
However, challenges include a 15% sales decline in China and first-quarter organic sales growth of 2%, below expectations. Despite this, overall optimism about P&G's future growth, supported by strategic measures, continues to drive the stock.
No.8
Meta Platforms(META.US)
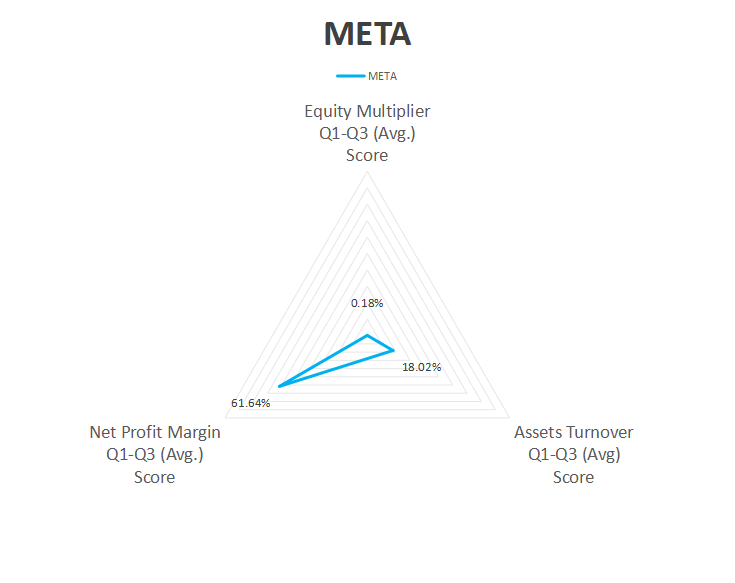
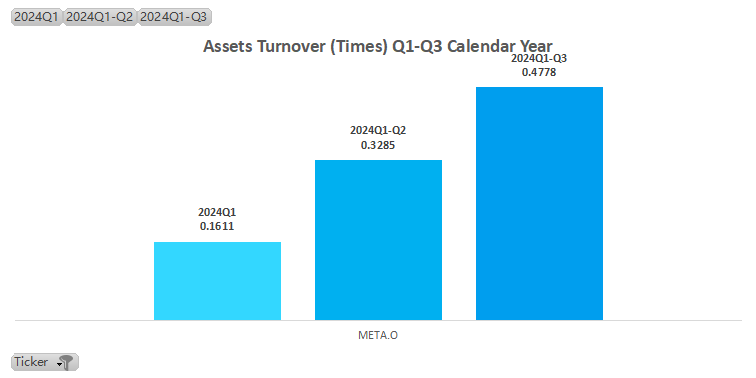
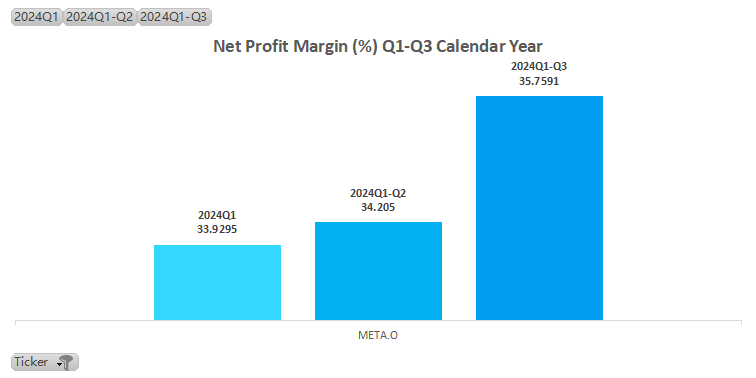
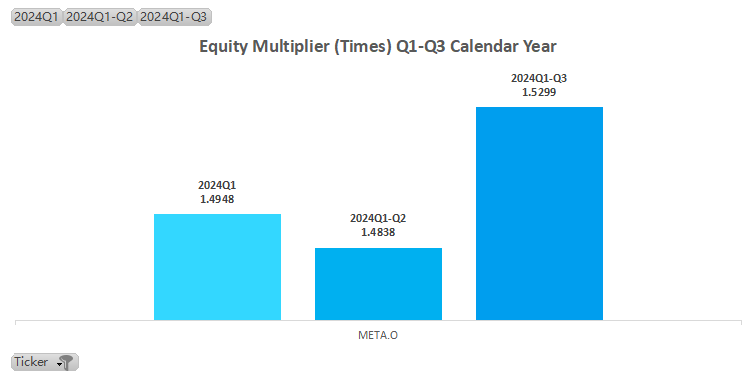
| Ticker | META.O |
| ROE Q1-Q3 (Avg.) | 16.99 |
| ROE Q3 | 26.1394 |
| Assets Turnover Q1-Q3 (Avg.) | 0.32 |
| Net Profit Margin Q1-Q3 (Avg.) [KEY FACTOR] | 34.63% |
| Equity Multiplier Q1-Q3 (Avg.) | 1.50 |
META Performance in 2024:
Meta Platforms(META.US)'s ROE is significantly driven by its high net profit margin, moderate asset turnover, and low financial leverage.
In 2024, META exhibited remarkable stock performance, with an 82.70% increase to US$632.68 by December 25. Contributing factors included a 19% revenue growth to US$40.6 billion and a 35% rise in net profit to US$15.69 billion in Q3, driven by AI advancements like the Llama 4 model. Positive ratings from analysts with targets up to US$675 further boosted the stock.
Despite challenges like rising capital expenditures projected between US$38 billion-40 billion and slowing ad revenue growth, Meta's AI investments and new products, such as smart and AR glasses, promise sustained long-term growth, supporting continued stock appreciation.
No.7
Microsoft Corporation(MSFT.US)
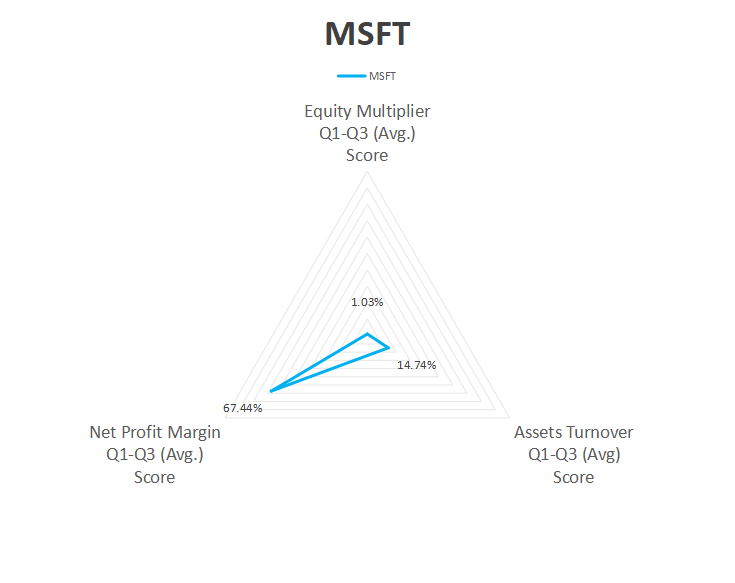
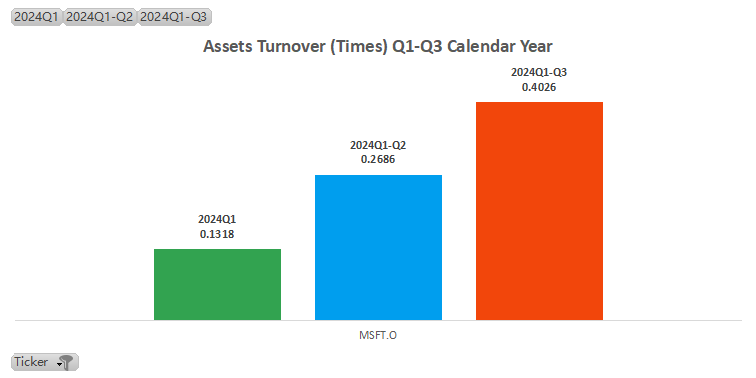
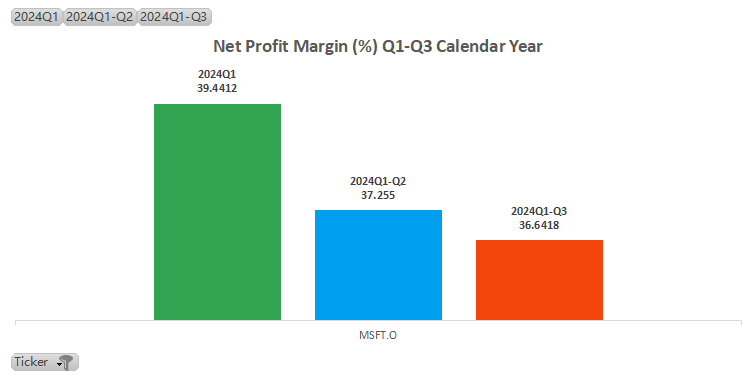
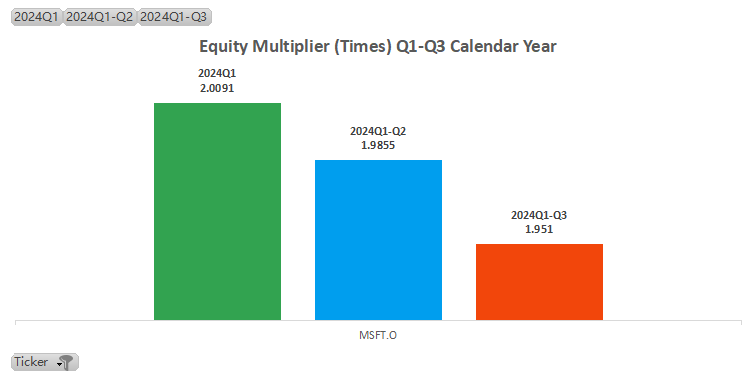
| Ticker | MSFT.O |
| ROE Q1-Q3 (Avg.) | 19.70 |
| ROE Q3 | 28.7782 |
| Assets Turnover Q1-Q3 (Avg.) | 0.27 |
| Net Profit Margin Q1-Q3 (Avg.) [KEY FACTOR] | 37.78% |
| Equity Multiplier Q1-Q3 (Avg.) | 1.98 |
MSFT Performance in 2024:
Microsoft Corporation(MSFT.US)'s ROE is significantly driven by its high net profit margin, moderate asset turnover, and low financial leverage.
MSFT stock price has experienced significant volatility in 2024, with the market reacting positively to its results and outlook. According to the financial results, fiscal 2024 revenue was US$245.1 billion, up 16% year on year, and net profit was US$88.1 billion, up 22% year on year, with intelligent cloud revenue up 20% year on year. Analysts forecast steady revenue growth between 2024 and 2027, with annual growth between 14.9% and 15.7%.
Several agencies upgraded their ratings and price targets, such as Stifel Nicolaus, which raised its price target to US$515. Institutions such as Greenleaf Trust added holdings of Microsoft in the third quarter.
No.6
Visa Inc. Class A(V.US)
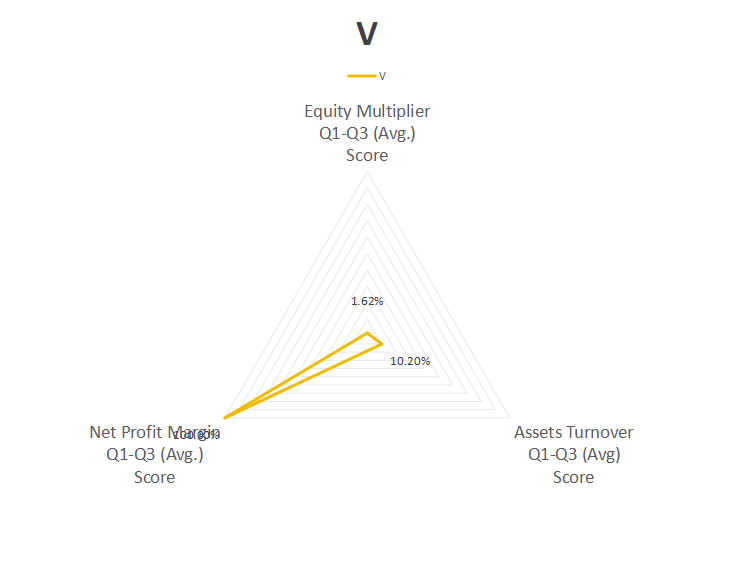
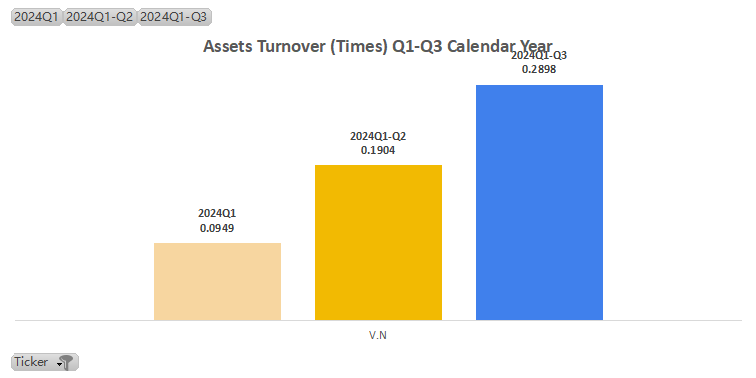
| Ticker | V.N |
| ROE Q1-Q3 (Avg.) | 24.45 |
| ROE Q3 | 36.7694 |
| Assets Turnover Q1-Q3 (Avg.) | 0.19 |
| Net Profit Margin Q1-Q3 (Avg.) [KEY FACTOR] | 55.45% |
| Equity Multiplier Q1-Q3 (Avg.) | 2.31 |
V Performance in 2024:
Visa Inc. Class A(V.US)'s ROE is significantly driven by its exceptionally high net profit margin, relatively low asset turnover, and moderate financial leverage.
Visa's stock price has had a strong year in 2024, hitting an all-time high of US$317.44 on Dec. 17, up 22.97% year over year, giving it a market capitalization of US$621.5 billion. The financial performance showed FY2024 profit of US$19.743 billion, up 14.3% YoY, revenue of US$35.926 billion, up 10.02% YOY, and EPS of US$9.74, up 17.49% YOY.
Specific quarterly performance, Q4 revenue of US$13.246 billion, net profit of US$5.394 billion. In terms of business performance, payment service fee revenue was US$4.2 billion, data processing fee revenue was US$4.6 billion, and cross-border business revenue was US$3.5 billion, up 8%, 8% and 9% year-on-year respectively.
No.5
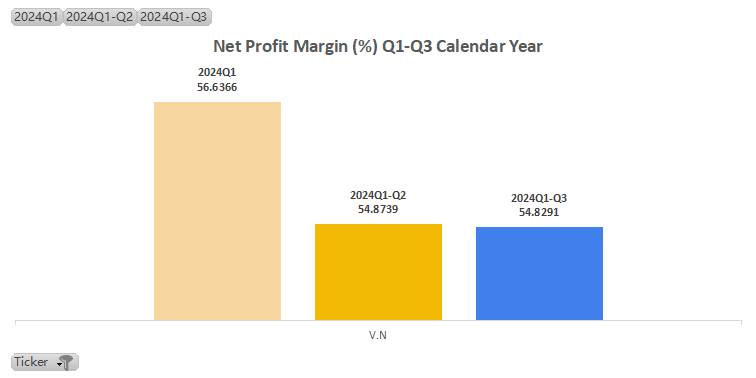
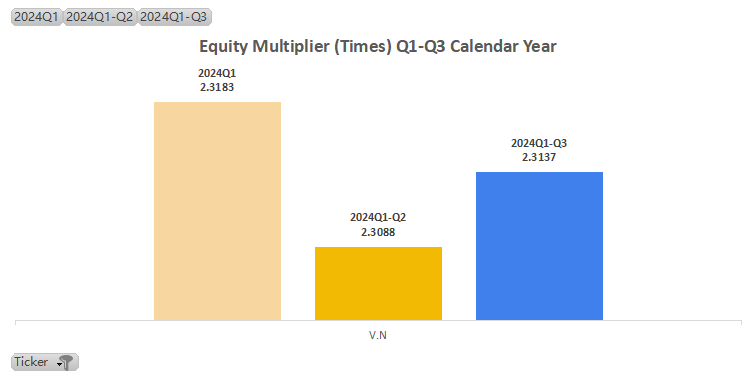
NVIDIA Corporation(NVDA.US)
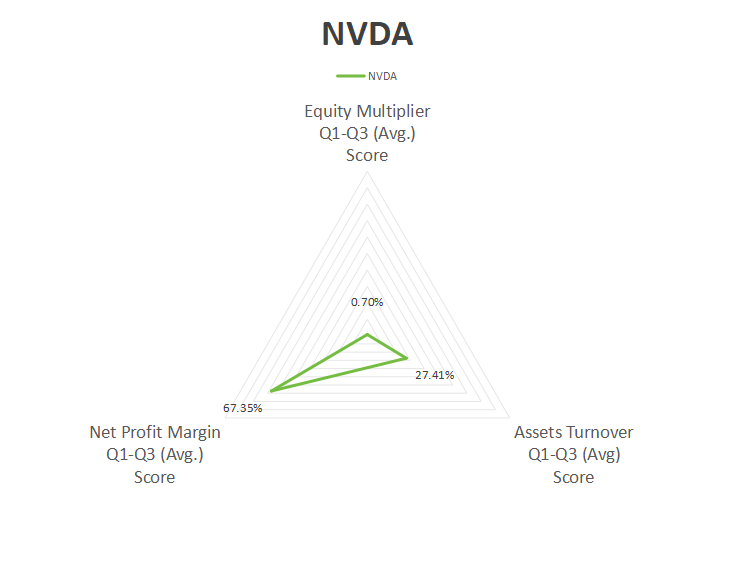
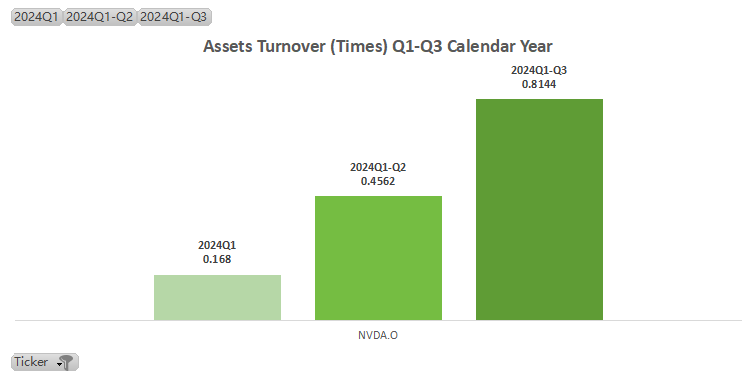
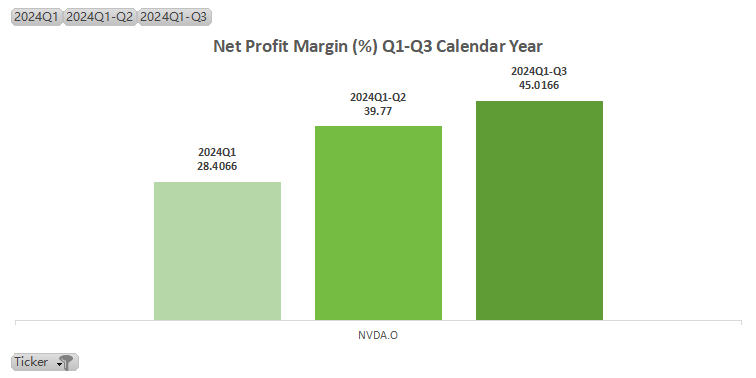
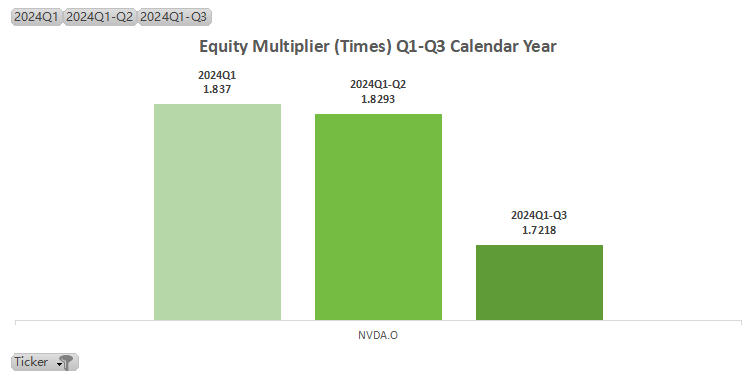
| Ticker | NVDA.O |
| ROE Q1-Q3 (Avg.) | 35.03 |
| ROE Q3 | 63.1254 |
| Assets Turnover Q1-Q3 (Avg.) | 0.48 |
| Net Profit Margin Q1-Q3 (Avg.) [KEY FACTOR] | 37.73% |
| Equity Multiplier Q1-Q3 (Avg.) | 1.80 |
NVDA Performance in 2024:
NVIDIA Corporation(NVDA.US)'s ROE is primarily driven by its high net profit margin, moderate asset turnover, and low financial leverage.
Being the most watched stocks on the year 2024, NVIDIA's stock experienced significant volatility. Initially, the stock showed strong growth, especially after Q4 earnings exceeded expectations in revenue and EPS, leading to post-earnings price drops due to high valuations.
However, by December 19, shares had fallen 4.85% over five days and 12.22% over thirty days, reflecting cautious market sentiment about future growth.
Q3 revenue was US$350.8 billion, with strong data centre performance, and the projected Q4 revenue is US$375 billion. Institutions provided positive ratings, with a high target of US$170, but concerns about supply constraints and market expansion linger.
No.4
Eli Lilly and Company(LLY.US)
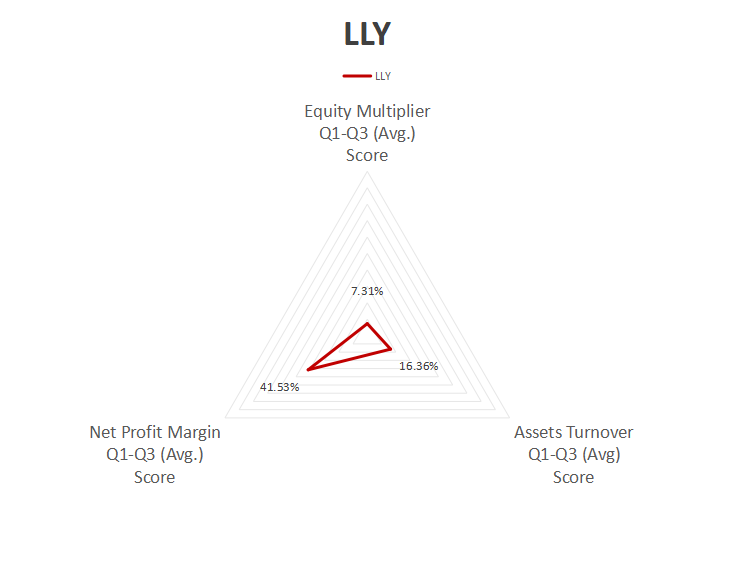
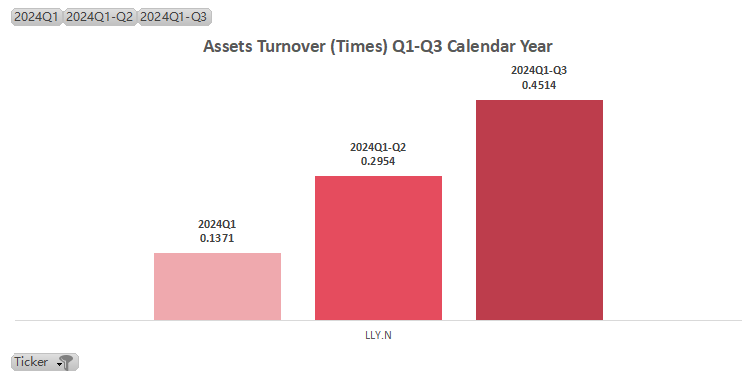
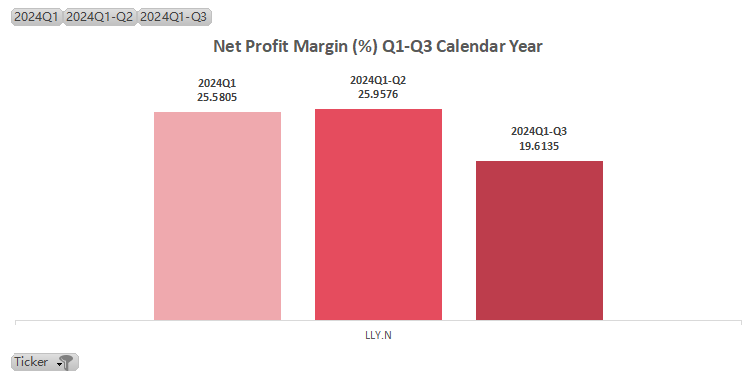
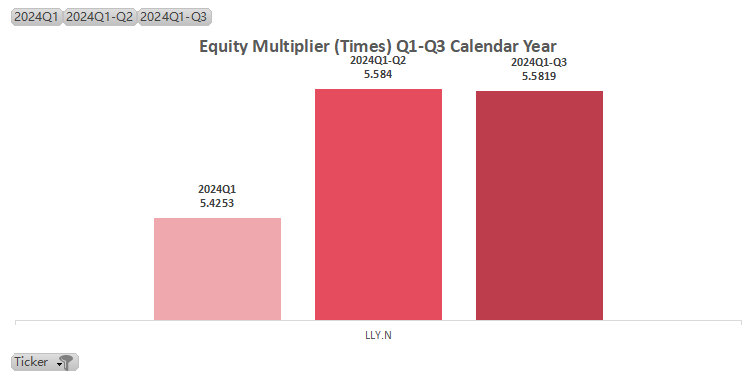
| Ticker | LLY.N |
| ROE Q1-Q3 (Avg.) | 37.09 |
| ROE Q3 | 49.4181 |
| Assets Turnover Q1-Q3 (Avg) | 0.29 |
| Net Profit Margin Q1-Q3 (Avg.) [KEY FACTOR] | 23.72% |
| Equity Multiplier Q1-Q3 (Avg.) | 5.53 |
LLY Performance in 2024:
Eli Lilly and Company(LLY.US)'s ROE is significantly driven by its high net profit margin, moderate asset turnover, and substantial financial leverage.
In 2024, LLY stock surged from around US$600 to nearly US$900, a 46% increase, driven by strong sales of metabolic disease drugs Mounjaro and Zepbound, with sales up 71% and 140%, respectively, in Q2. The company's efforts in expanding capacity, particularly for tirzepatide, and progress in oncology, immunology, and neuroscience also bolstered growth.
Despite a strong performance, stock volatility occurred, notably a near-16% drop before earnings reports due to market concerns. Analyst ratings varied, with Morgan Stanley setting a US$950 target, while some downgraded to "hold."
Prospects include a US$1 trillion market cap target and a US$150 billion stock buyback plan, despite competitive and pricing pressures.
No.3
Apple Inc.(AAPL.US)
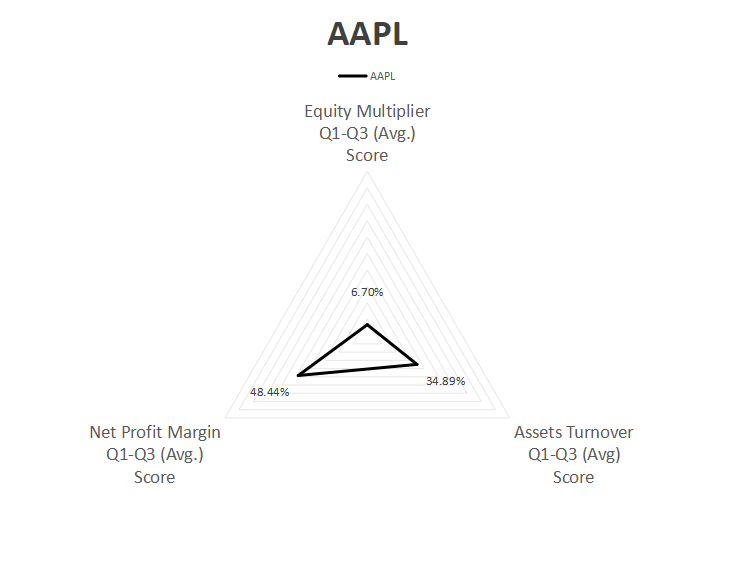
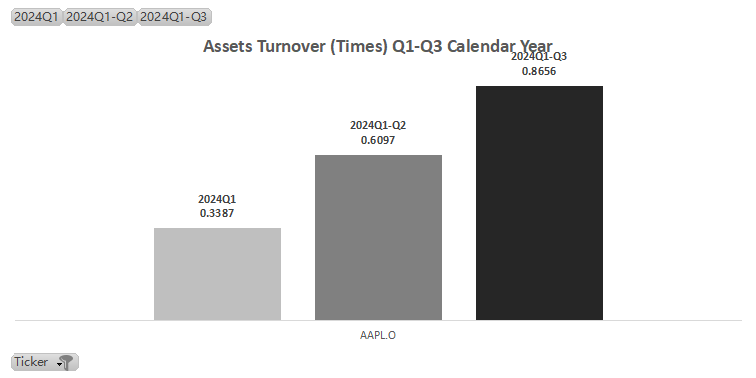
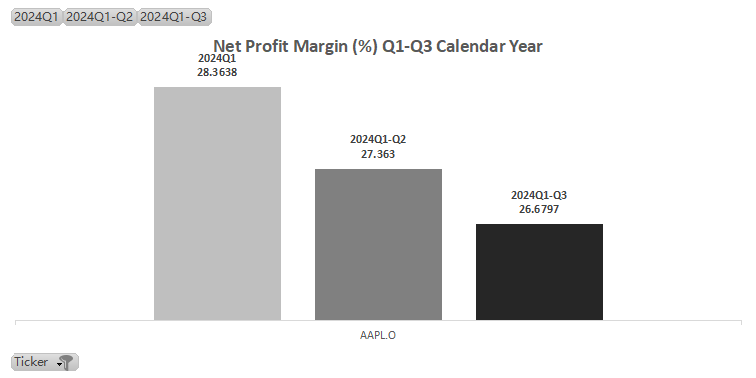
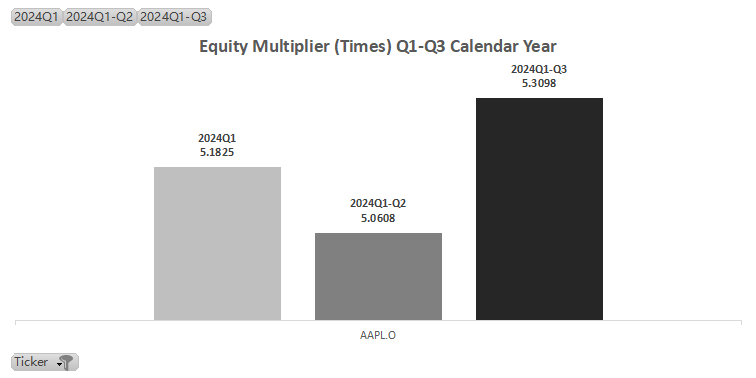
| Ticker | AAPL.O |
|---|---|
| ROE Q1-Q3 (Avg.) | 85.61 |
| ROE Q3 | 122.6194 |
| Assets Turnover Q1-Q3 (Avg) [KEY FACTOR] | 0.60 |
| Net Profit Margin Q1-Q3 (Avg.) [KEY FACTOR] | 27.47% |
| Equity Multiplier Q1-Q3 (Avg.) | 5.18 |
AAPL Performance in 2024:
Apple Inc.(AAPL.US)'s ROE is significantly driven by its high net profit margin, efficient asset turnover, and substantial financial leverage.
In 2024, AAPL stock exhibited significant volatility, beginning the year with merely a 12% rise. However, strong financial reports and new product launches, notably the iPhone 16, boosted the stock's performance.
By Q4 FY2024, Apple exceeded market expectations with US$949.3 billion in revenue, despite a 35.8% drop in net profit due to a one-time tax expense. Adjusted EPS was US$1.64, surpassing the estimated US$1.58. Apple's services sector achieved a record US$249.72 billion.
Analysts forecast growth driven by AI features, with a PE ratio of 33x for 2025, suggesting a US$3.75 trillion market cap. Consequently, Apple regained its position as the highest-valued company globally.
No.2
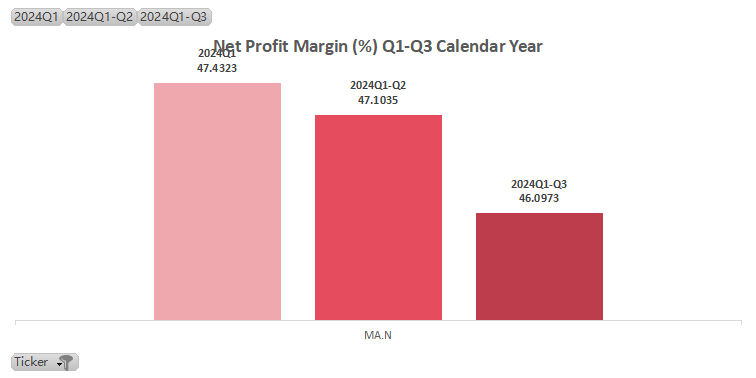
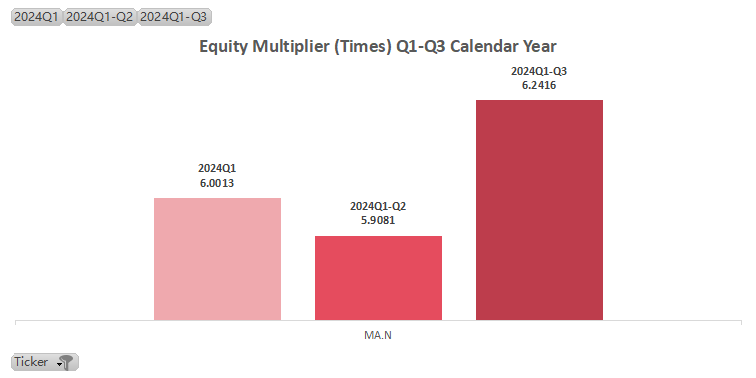
MasterCard Incorporated Class A(MA.US)
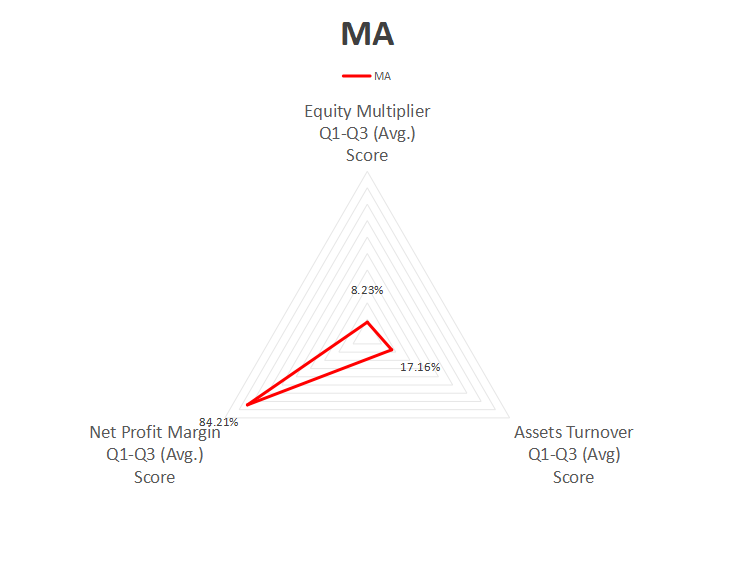
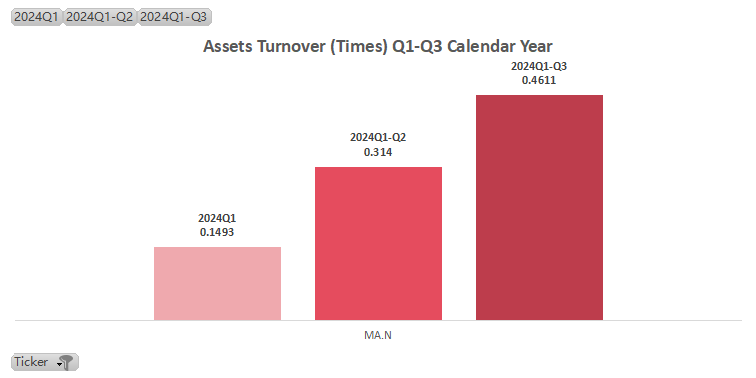
| Ticker | MA.N |
|---|---|
| ROE Q1-Q3 (Avg.) | 87.51 |
| ROE Q3 | 132.6745 |
| Assets Turnover Q1-Q3 (Avg) | 0.31 |
| Net Profit Margin Q1-Q3 (Avg.) [KEY FACTOR] | 46.88% |
| Equity Multiplier Q1-Q3 (Avg.) | 6.05 |
MA Performance in 2024:
Mastercard's ROE is significantly driven by its very high net profit margin, moderate asset turnover, and substantial financial leverage.
In 2024, MasterCard's stock exhibited robust performance, reaching US$534.1 on November 30 and peaking further at US$537.00 by December 20. The company's strong financial performance drove this growth, with a revenue growth rate of 11.73% and a 15% year-over-year increase in net profit in Q1. Non-GAAP EPS grew by 18% to US$3.31, while cross-border revenue increased by 21%.
Despite its high valuation, analysts remain optimistic, with target prices ranging from US$588 to US$654. The company also announced a 15% dividend increase and a new US$12 billion stock buyback plan, enhancing investor confidence.
No.1
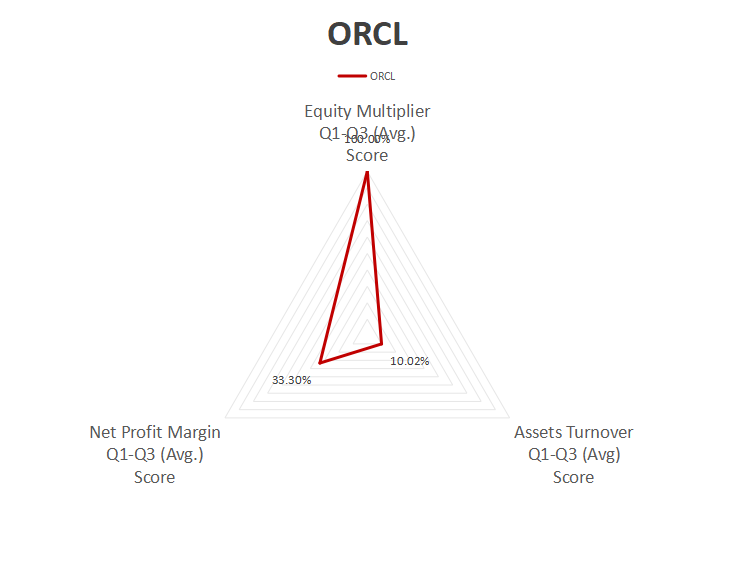
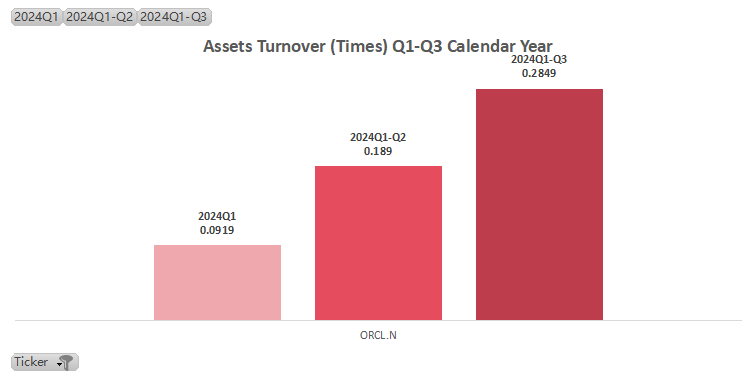
Oracle Corporation(ORCL.US)

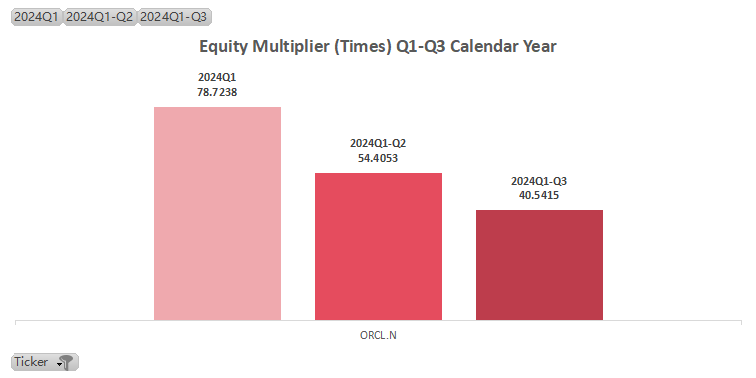
| Ticker | ORCL.N |
| ROE Q1-Q3 (Avg.) | 186.22 |
| ROE | 218.7276 |
| Assets Turnover Q1-Q3 (Avg) | 0.19 |
| Net Profit Margin Q1-Q3 (Avg.) | 19.25% |
| Equity Multiplier Q1-Q3 (Avg.) [KEY FACTOR] | 57.89 |
ORCL Performance in 2024:
Oracle Corporation(ORCL.US)'s ROE is significantly driven by its very high financial leverage and net profit margin, but moderate asset turnover.
In 2024, ORCL stock increased from US$142.61 to US$168.74, a rise of approximately 18.33%. The Q1 2025 financial report exceeded expectations with total revenue of US$13.3 billion, a 7% increase, GAAP EPS of US$1.03 (20% growth), and non-GAAP EPS of US$1.39 (17% growth). Cloud services revenue grew 21% to US$5.6 billion.
Oracle's stock hit a high of US$173.99, and analysts have raised target prices, such as Jefferies to US$190 and Evercore ISI to US$175. Future growth is supported by a projected RPO increase of 53% to US$99 billion.