
Please use a PC Browser to access Register-Tadawul
Get It
A Look At AllianceBernstein Holding (AB) Valuation After Onur Erzan’s Appointment As President
AllianceBernstein Holding L.P. AB | 40.17 | +2.34% |
AllianceBernstein Holding (AB) has drawn fresh attention after appointing Onur Erzan as President, expanding his remit across business transformation, distribution and new product lines such as active ETFs and insurance asset management.
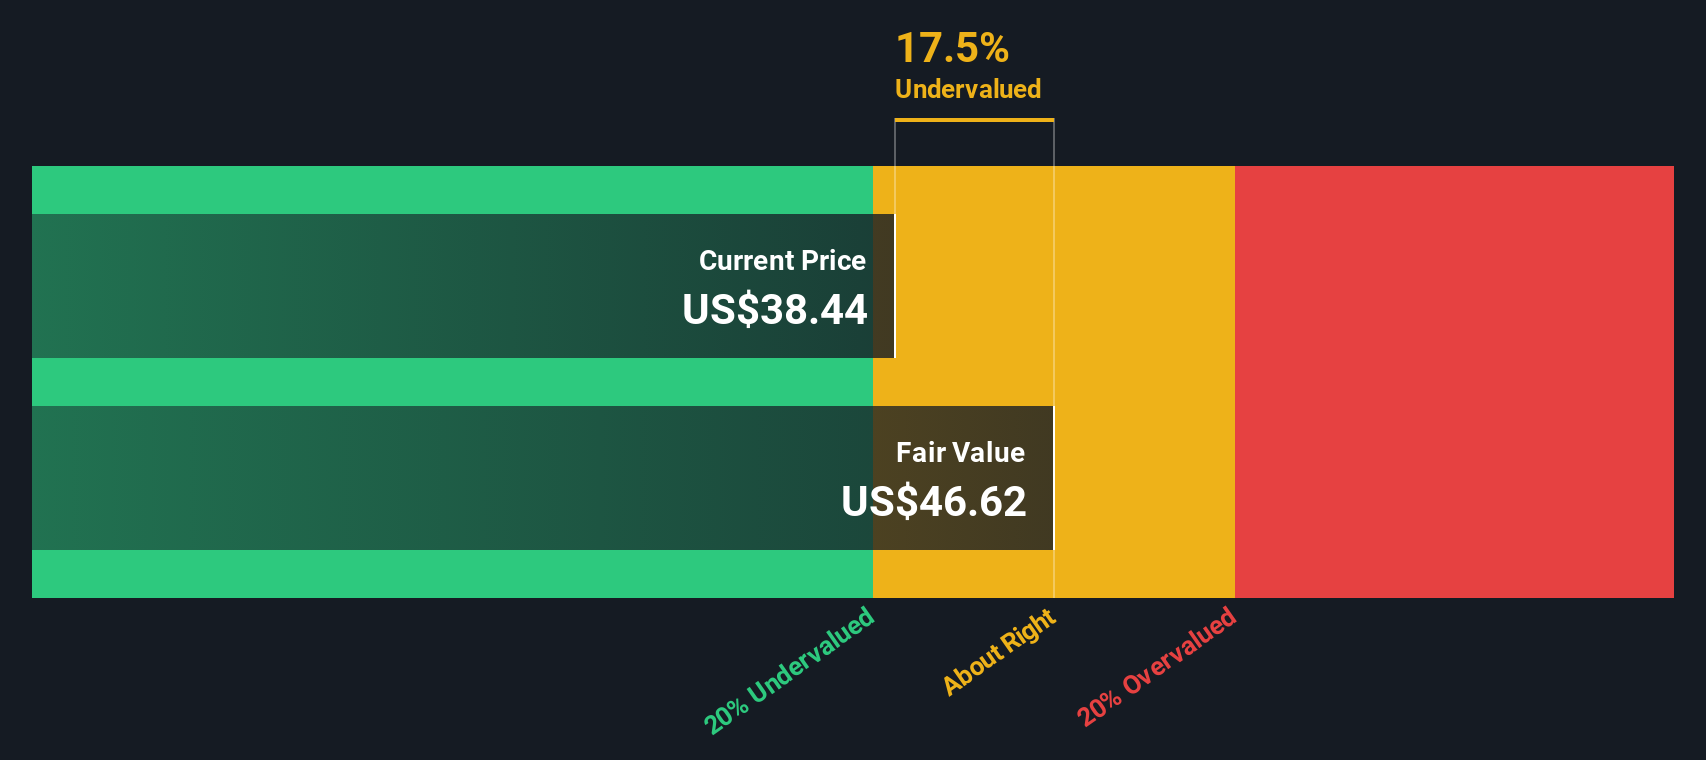
The latest leadership change comes as AllianceBernstein Holding’s share price, at about US$38.40, has seen a 30 day share price return decline of 5.4%, while the 1 year total shareholder return of 13.8% points to momentum that has held up over a longer period.
If you are looking beyond asset managers, this could be a moment to widen your search and check out fast growing stocks with high insider ownership.
With the share price around US$38.40 after a recent 5.4% 30 day decline, yet a 1 year total return of 13.8%, the key question is whether AllianceBernstein is still undervalued or if the market is already pricing in future growth.
At a last close of about US$38.40, AllianceBernstein Holding trades on a P/E of 10.8x, which screens as inexpensive against both the wider US market and its capital markets peers.
The P/E multiple compares the share price to earnings per share, so it effectively shows how much you are paying for each dollar of current earnings. For an asset manager like AllianceBernstein, this is a common yardstick because earnings reflect fee income, operating efficiency and profit sharing with unitholders.
Here, the 10.8x P/E sits well below the US market average of 19.1x, and also below the US Capital Markets industry average of 25.8x. It also comes in under the SWS fair P/E estimate of 12.3x, a level our fair ratio model suggests the market could move toward if pricing and fundamentals align more closely over time.
Result: Price-to-Earnings of 10.8x (UNDERVALUED)
However, you still have to weigh risks such as an annual net income decline of about 2% and recent short-term share price weakness against that lower P/E.
While the 10.8x P/E points to value, our DCF model paints a cooler picture. With an estimate of fair value at about US$35.49 versus the current US$38.40, the units screen as slightly overvalued. This raises the question: is the market already paying up for expected revenue growth?
Simply Wall St performs a discounted cash flow (DCF) on every stock in the world every day (check out AllianceBernstein Holding for example). We show the entire calculation in full. You can track the result in your watchlist or portfolio and be alerted when this changes, or use our stock screener to discover 881 undervalued stocks based on their cash flows. If you save a screener we even alert you when new companies match - so you never miss a potential opportunity.
If you see the numbers differently or enjoy checking the data firsthand, you can build your own view in minutes by starting with Do it your way.
A great starting point for your AllianceBernstein Holding research is our analysis highlighting 3 key rewards and 4 important warning signs that could impact your investment decision.
If AllianceBernstein is on your radar, do not stop there. Consider widening your watchlist with other focused ideas that could fit different roles in your portfolio.
This article by Simply Wall St is general in nature. We provide commentary based on historical data and analyst forecasts only using an unbiased methodology and our articles are not intended to be financial advice. It does not constitute a recommendation to buy or sell any stock, and does not take account of your objectives, or your financial situation. We aim to bring you long-term focused analysis driven by fundamental data. Note that our analysis may not factor in the latest price-sensitive company announcements or qualitative material. Simply Wall St has no position in any stocks mentioned.
