
Please use a PC Browser to access Register-Tadawul
Get It
A Look At Blue Owl Capital (OWL) Valuation After Shareholder Lawsuits And Liquidity Concerns
Blue Owl Capital Inc. Class A Common Stock OWL | 8.75 | +1.63% |
Interest in Blue Owl Capital (OWL) has picked up after a wave of shareholder class action lawsuits accused the firm of hiding liquidity pressures tied to business development company redemptions and missed earnings expectations.
The lawsuits and missed earnings have coincided with a clear loss of momentum. The 7 day share price return of 9.91% and 90 day share price return of 15.59% have contributed to a 1 year total shareholder return of 45.16%.
If this kind of legal and sentiment shift has you reassessing financials, it could be a good moment to widen your search with fast growing stocks with high insider ownership.
With the share price down over the past year despite revenue and net income growth, and analysts’ targets sitting well above the current US$13.64 level, you have to ask: is there real mispricing here, or is the market already factoring in Blue Owl’s future growth?
With Blue Owl Capital last closing at $13.64 versus a narrative fair value of about $20.82, the current setup hinges on how durable its fee engine really is.
Exceptional long term opportunities in digital infrastructure, fueled by generational investment in data centers/AI related assets where Blue Owl has industry leadership, are catalyzing large scale fundraising and deployment, supporting robust growth in management fees and recurring revenues over the next several years.
Curious what earnings, revenue mix, and margin profile would need to line up for that fair value to make sense? The narrative leans on compound growth, expanding profitability, and a future valuation multiple that looks closer to mature capital markets leaders rather than early stage platforms, all framed through a specific discount rate and AUM trajectory you can scrutinize for yourself.
Result: Fair Value of $20.82 (UNDERVALUED)
However, that story can break if fundraising slows or fee rates come under pressure, particularly as compliance costs rise and competition in private credit and real assets becomes tougher.
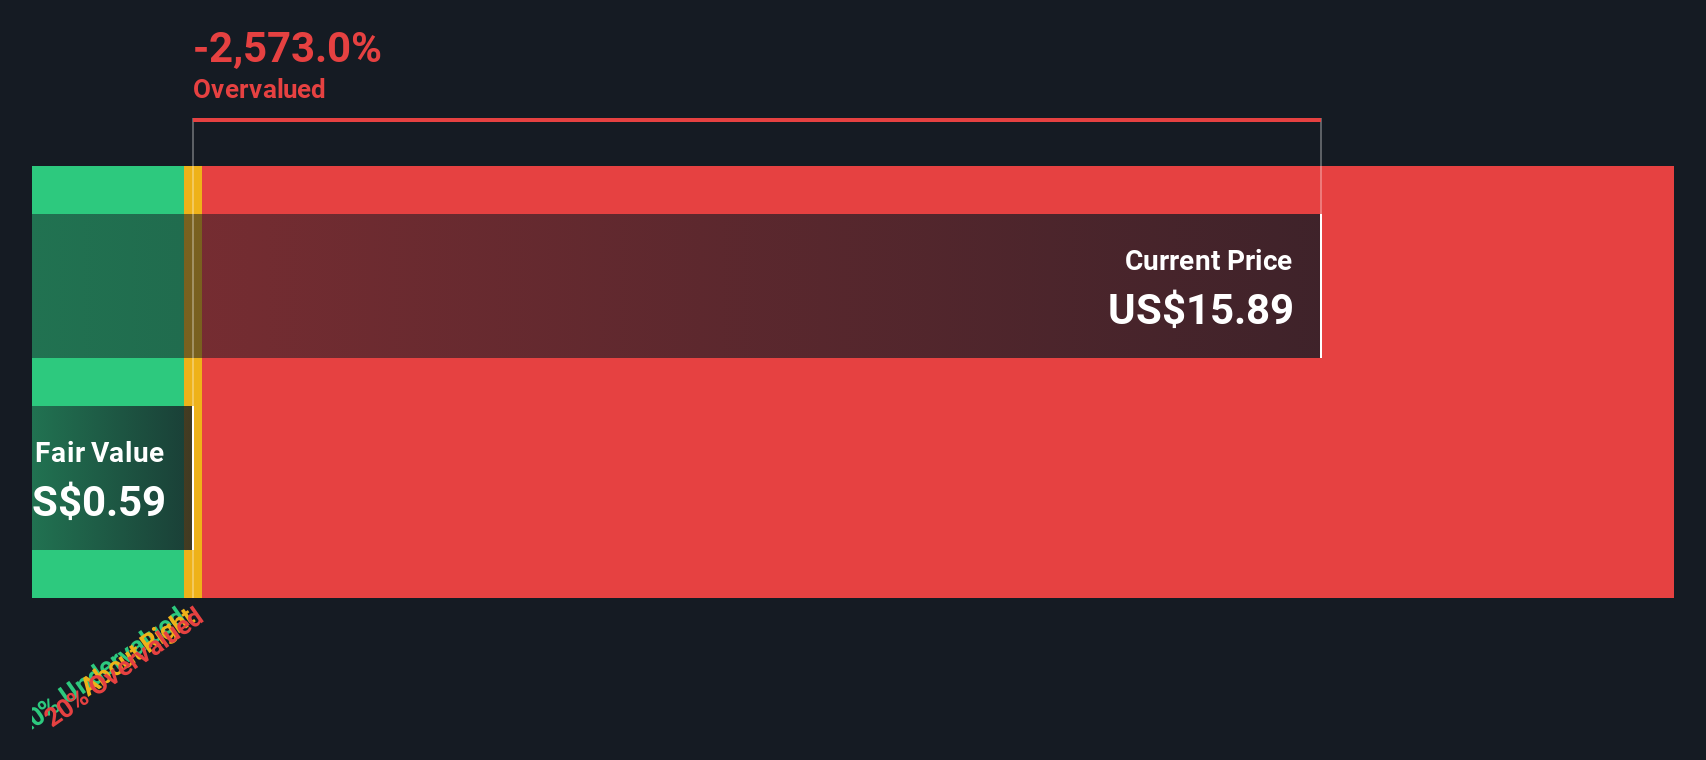
While the narrative fair value sits at about $20.82 and points to 34.5% undervaluation, our DCF model comes out far more conservative, with a future cash flow value of just $0.55. That kind of gap raises a simple question: which set of assumptions do you trust more?
Simply Wall St performs a discounted cash flow (DCF) on every stock in the world every day (check out Blue Owl Capital for example). We show the entire calculation in full. You can track the result in your watchlist or portfolio and be alerted when this changes, or use our stock screener to discover 875 undervalued stocks based on their cash flows. If you save a screener we even alert you when new companies match - so you never miss a potential opportunity.
If you are not fully convinced by these narratives or simply prefer to weigh the numbers firsthand, you can build your own view in minutes with Do it your way.
A great starting point for your Blue Owl Capital research is our analysis highlighting 2 key rewards and 4 important warning signs that could impact your investment decision.
If Blue Owl has sharpened your thinking, do not stop here. Widen your watchlist now or you risk missing other opportunities hiding in plain sight.
This article by Simply Wall St is general in nature. We provide commentary based on historical data and analyst forecasts only using an unbiased methodology and our articles are not intended to be financial advice. It does not constitute a recommendation to buy or sell any stock, and does not take account of your objectives, or your financial situation. We aim to bring you long-term focused analysis driven by fundamental data. Note that our analysis may not factor in the latest price-sensitive company announcements or qualitative material. Simply Wall St has no position in any stocks mentioned.
