
Please use a PC Browser to access Register-Tadawul
Get It
A Look At EastGroup Properties (EGP) Valuation After Strong Earnings Beat And Positive Guidance
EastGroup Properties, Inc. EGP | 192.92 | +1.20% |
EastGroup Properties (EGP) recently reported fourth quarter and full year 2025 results, along with new 2026 earnings guidance, giving investors a clear update on its industrial real estate portfolio and earnings outlook.
Following the earnings release and 2026 guidance, EastGroup Properties’ share price has gained momentum, with a 7 day share price return of 5.25% and a 1 year total shareholder return of 11.23%, suggesting improving sentiment around its industrial portfolio and income outlook.
If this earnings update has you thinking about where else to put fresh capital to work, it could be a good time to broaden your search and check out 22 top founder-led companies.
With the share price already up and EastGroup trading at about a 14% discount to one intrinsic value estimate and roughly 6% below the average analyst target, investors may ask whether there is still a buying opportunity here or whether the market is already pricing in future growth.
At a last close of $189.91 versus a narrative fair value of about $200.63, EastGroup Properties is framed as modestly undervalued, with that view anchored in detailed assumptions about revenue, margins and future earnings multiples.
Structural US population growth and migration to Sunbelt markets continues to underpin robust demand for modern industrial/logistics properties, directly benefiting EastGroup's core portfolio and positioning the company for sustained revenue and NOI growth as these regions outpace national averages.
Persistent e-commerce expansion and ongoing supply chain modernization are ensuring elevated leasing spreads and high occupancy in EastGroup's infill, last-mile logistics facilities, supporting above-average rental rate growth and driving resilient net margins.
Curious how this Sunbelt focused, logistics heavy story translates into that fair value figure? The most followed narrative leans on higher rents, wider margins and a future earnings multiple that is usually linked with faster growing sectors. Want to see the exact growth, profitability and discount rate assumptions behind that $200 plus view?
Result: Fair Value of $200.63 (UNDERVALUED)
However, that story can change quickly if tenant demand softens in weaker markets like Southern California or if higher interest rates continue to constrain EastGroup’s access to affordable capital.
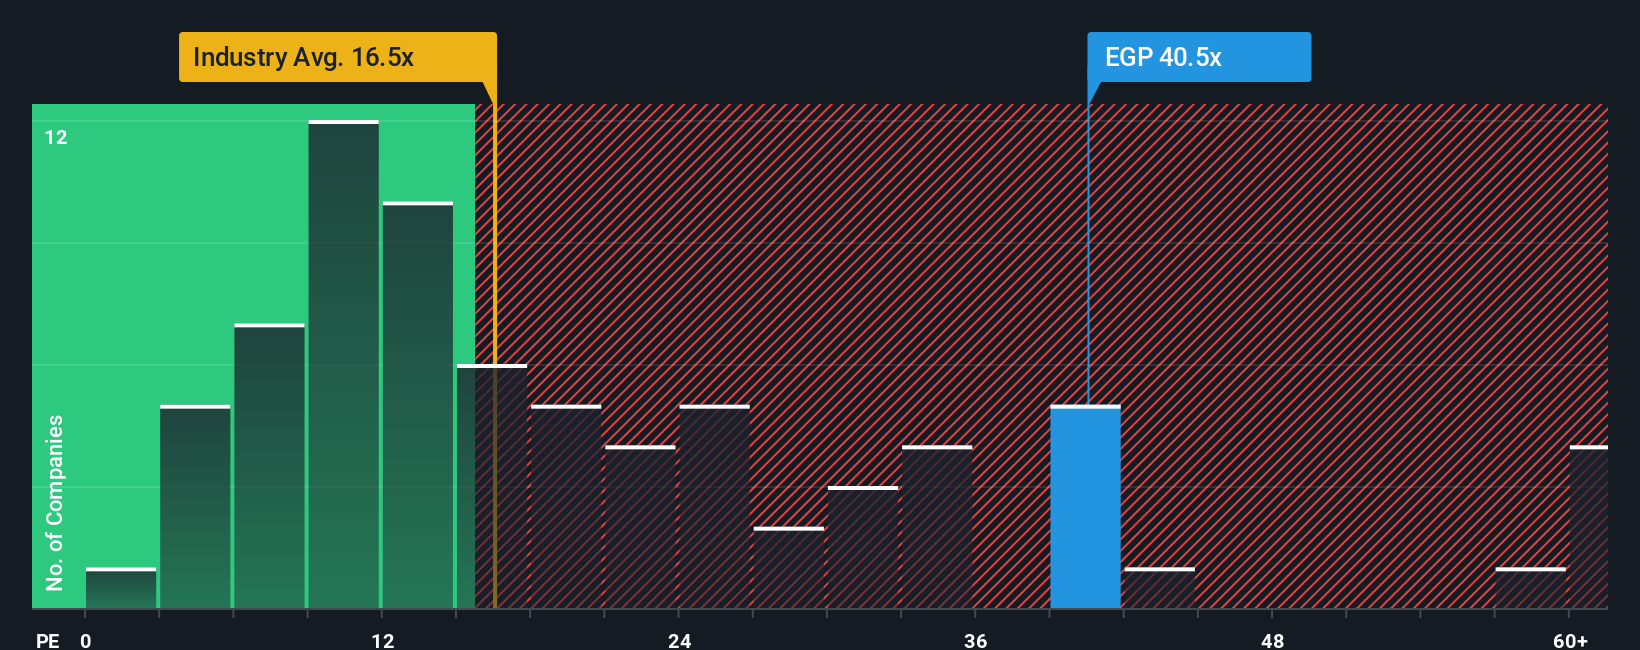
That 5.3% undervaluation story sits alongside a much tighter picture when you look at the current P/E. At 39.3x, EGP trades well above both the US peer average of 31.1x and the Global Industrial REITs average of 17.4x, and even above its own fair ratio of 34.7x.
In practical terms, you are paying a premium price that already bakes in a lot of good news, which can leave less room for error if growth or pricing power do not fully match expectations. The real question is whether you see that premium as justified or as extra risk you are taking on.
If you see the numbers differently or simply prefer to test your own assumptions, you can build a complete story for EastGroup in just a few minutes, starting with Do it your way.
A great starting point for your EastGroup Properties research is our analysis highlighting 4 key rewards and 1 important warning sign that could impact your investment decision.
If you stop with just one stock, you could miss opportunities that fit your style even better, so use the screener to line up your next moves.
This article by Simply Wall St is general in nature. We provide commentary based on historical data and analyst forecasts only using an unbiased methodology and our articles are not intended to be financial advice. It does not constitute a recommendation to buy or sell any stock, and does not take account of your objectives, or your financial situation. We aim to bring you long-term focused analysis driven by fundamental data. Note that our analysis may not factor in the latest price-sensitive company announcements or qualitative material. Simply Wall St has no position in any stocks mentioned.
