
Please use a PC Browser to access Register-Tadawul
Get It
A Look At ExlService Holdings (EXLS) Valuation After Mixed Recent Shareholder Returns
ExlService Holdings, Inc. EXLS | 30.07 | -1.12% |
ExlService Holdings (EXLS) has drawn attention after recent trading, with the stock closing at $42.68 and showing mixed return patterns over the past year. This has prompted a closer look at how the business is positioned today.
Recent trading has been relatively steady, with a 7 day share price return of 3.57% and a 90 day share price return of 4.58%. However, the 1 year total shareholder return shows a 5.39% decline, which contrasts with a 151.44% gain over five years. This suggests that longer term holders have seen stronger results than those focused on the past year.
If ExlService Holdings has you thinking about where else growth and ownership conviction might align, this could be a good moment to check out fast growing stocks with high insider ownership.
With ExlService Holdings trading at $42.68, showing steady revenue and net income growth and sitting below some analyst and intrinsic value estimates, the real question is whether this reflects a genuine opportunity or whether the market is already pricing in future growth.
With ExlService Holdings last closing at $42.68 against a narrative fair value of $52.14, the widely followed view is that the shares sit at a discount to modeled fundamentals.
The accelerated global adoption of AI and digital transformation in regulated industries is expanding the addressable market for ExlService, driving strong double-digit pipeline and growing annuity-like revenues. This trend supports sustained revenue growth and improved earnings visibility. Increasing reliance by clients on advanced data and AI-driven solutions for operational efficiency positions ExlService to generate higher-margin services, benefiting both revenue mix and long-term margin expansion as traditional usage-based contracts transition to outcome-based commercial models.
Curious what kind of revenue run rate, margin profile, and future P/E multiple underpin that gap between price and fair value? The narrative connects steady top line expansion, a modest lift in profitability, and a premium earnings multiple to justify its valuation path. If you want to see exactly how those moving parts fit together, the full story lays out each step in detail.
Result: Fair Value of $52.14 (UNDERVALUED)
However, you should keep in mind that tighter data privacy rules and rising wage and talent costs could pressure margins and challenge the upbeat AI growth story.
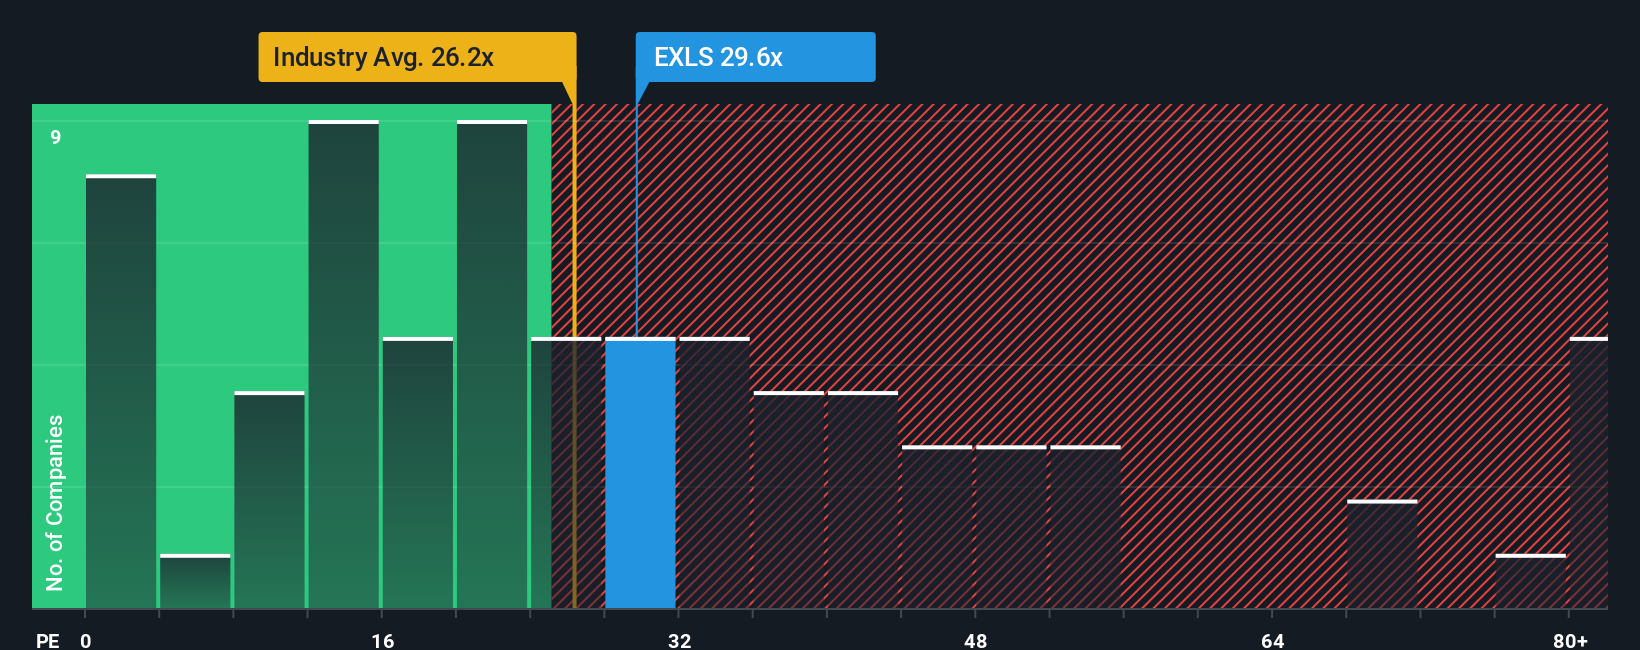
While the narrative fair value suggests ExlService Holdings is undervalued, the current P/E of 27.8x is higher than the US Professional Services industry at 25.1x and above its own fair ratio of 24.5x. That points to some valuation risk even if the long term story looks appealing. How comfortable are you paying a premium today?
If parts of this story do not quite fit how you see ExlService Holdings, you can review the same data, test your own assumptions, and build a custom narrative in just a few minutes with Do it your way.
A great starting point for your ExlService Holdings research is our analysis highlighting 4 key rewards and 1 important warning sign that could impact your investment decision.
If ExlService Holdings has sharpened your thinking, do not stop here. Use the Simply Wall St Screener to surface other focused ideas that match your style.
This article by Simply Wall St is general in nature. We provide commentary based on historical data and analyst forecasts only using an unbiased methodology and our articles are not intended to be financial advice. It does not constitute a recommendation to buy or sell any stock, and does not take account of your objectives, or your financial situation. We aim to bring you long-term focused analysis driven by fundamental data. Note that our analysis may not factor in the latest price-sensitive company announcements or qualitative material. Simply Wall St has no position in any stocks mentioned.
