
Please use a PC Browser to access Register-Tadawul
Get It
A Look At First Mid Bancshares (FMBH) Valuation After Steady Q4 Earnings And Dividend Reaffirmation
First Mid Bancshares, Inc. FMBH | 38.99 38.99 | -0.99% 0.00% Post |
First Mid Bancshares (FMBH) is back in focus after reporting fourth quarter earnings that matched Wall Street expectations, slightly weaker revenue net of interest expense, full year profit growth, and a reaffirmed quarterly dividend.
The recent earnings beat on expectations, lower net charge offs, and reaffirmed dividend have come alongside an 8.98% 1 month share price return and a 17.14% 3 month share price return, pointing to building momentum that contrasts with a steadier 13.91% 1 year total shareholder return.
If this kind of bank earnings story has your attention, it could be a good moment to broaden your watchlist with fast growing stocks with high insider ownership.
With the share price up strongly over the past quarter, earnings and dividends holding steady, and the stock trading below the average analyst target and some intrinsic estimates, is there still mispricing here, or is the market already baking in future growth?
At a last close of $42.10, First Mid Bancshares is on a P/E of 11x, which screens as good value against its peers and the wider US banks group.
The P/E ratio compares the current share price to earnings per share, so for a bank like FMBH it gives a quick read on how the market is pricing its profit stream today.
Here, the stock is described as trading at good value versus both the US Banks industry average P/E of 11.8x and a peer average of 11.5x, suggesting the market is not paying a premium for its earnings. The ratio also sits below an estimated fair P/E of 13.1x.
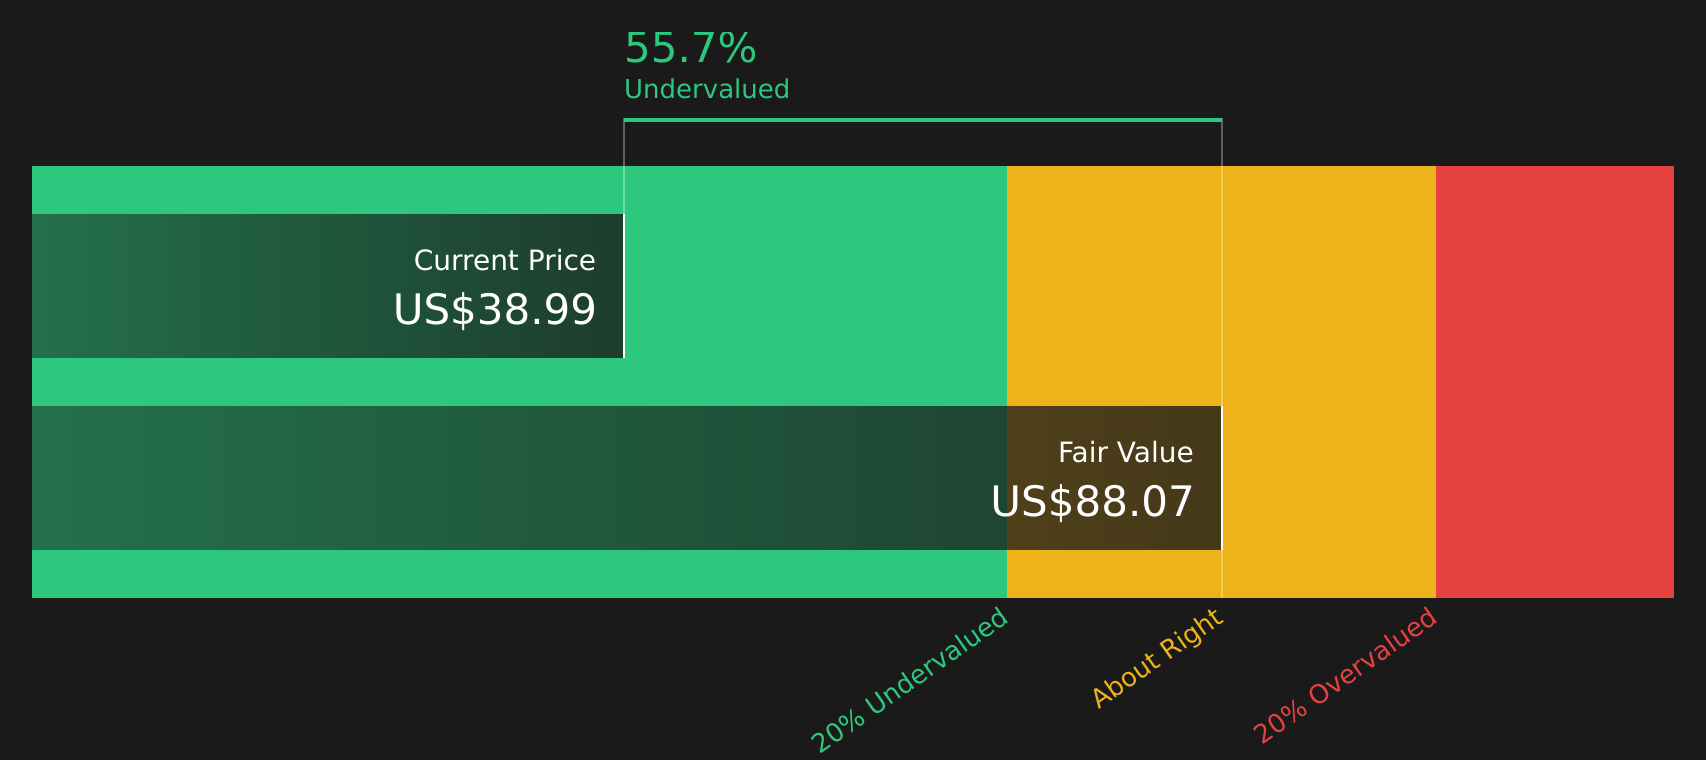
Against that backdrop, FMBH is flagged as trading at 52.4% below an internal fair value estimate based on future cash flows, which frames the current P/E as conservative rather than stretched.
Result: Price-to-Earnings of 11x (UNDERVALUED)
However, you still need to watch for the recent annual revenue decline of 1.1% and any shift in credit quality that could challenge the current value story.
Our DCF model suggests First Mid Bancshares, at $42.10, is about 52.4% below an estimated future cash flow value of $88.39. That also aligns with the idea of a fair P/E of 13.1x compared with the current 11x. If both measures indicate potential value, what might change that gap?
Simply Wall St performs a discounted cash flow (DCF) on every stock in the world every day (check out First Mid Bancshares for example). We show the entire calculation in full. You can track the result in your watchlist or portfolio and be alerted when this changes, or use our stock screener to discover 875 undervalued stocks based on their cash flows. If you save a screener we even alert you when new companies match - so you never miss a potential opportunity.
If you see the numbers differently or simply prefer to work through the data yourself, you can pull the key inputs together in just a few minutes and Do it your way.
A great starting point for your First Mid Bancshares research is our analysis highlighting 4 key rewards and 1 important warning sign that could impact your investment decision.
If FMBH has sparked your interest, do not stop here, use the same tools to spot other opportunities that could suit your goals and risk appetite.
This article by Simply Wall St is general in nature. We provide commentary based on historical data and analyst forecasts only using an unbiased methodology and our articles are not intended to be financial advice. It does not constitute a recommendation to buy or sell any stock, and does not take account of your objectives, or your financial situation. We aim to bring you long-term focused analysis driven by fundamental data. Note that our analysis may not factor in the latest price-sensitive company announcements or qualitative material. Simply Wall St has no position in any stocks mentioned.
