
Please use a PC Browser to access Register-Tadawul
Get It
A Look At Interactive Brokers Group (IBKR) Valuation After Zacks Rank 2 Upgrade And Earnings Estimate Revisions
Interactive Brokers Group, Inc. Class A IBKR | 74.39 | +0.55% |
Interactive Brokers Group (IBKR) recently attracted renewed attention after receiving a Zacks Rank #2 (Buy) upgrade, reflecting higher earnings estimates over the past 3 months and analysts indicating stronger underlying business trends.
The recent upgrade appears against a backdrop of firm share price momentum, with a 30 day share price return of 13.49% and a 1 year total shareholder return of 54.38%. This points to interest that extends well beyond the latest rating change.
If this kind of ongoing interest in brokers has caught your eye, it could be a good time to see what else is moving using fast growing stocks with high insider ownership.
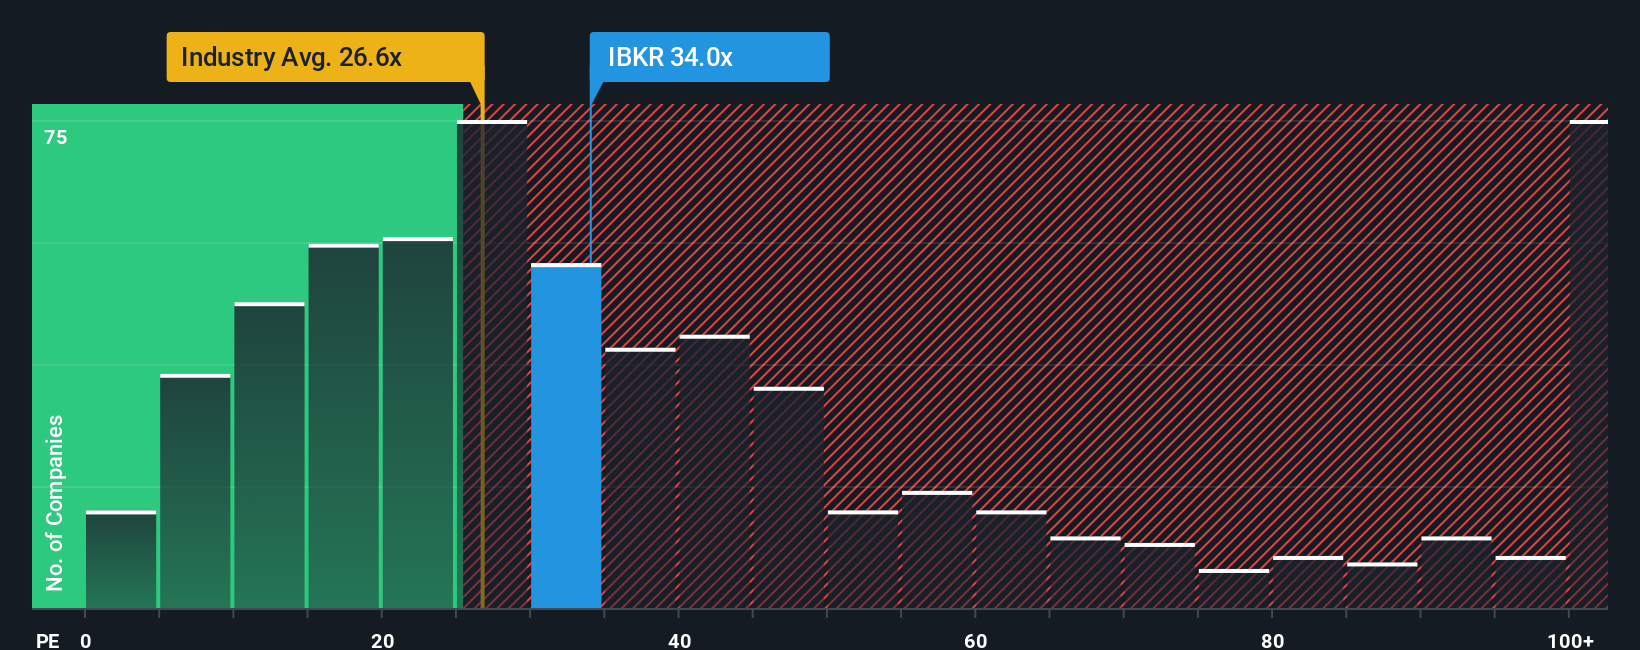
So with earnings estimates moving up, a P/E of 34.16 against an industry figure near 99.54 and shares already up strongly, is Interactive Brokers still mispriced, or are markets already baking in the growth story?
At a last close of US$71.35 against a fair value estimate of about US$76.89, the prevailing narrative suggests the shares trade at a discount, with that gap resting on specific growth and margin assumptions.
The introduction of new products and enhancements, such as the strengthened ATS with new liquidity providers and order types, enhancements to the IBKR Financial Advisor Portal, and the launch of securities lending for Swedish stocks, suggests potential for increased trading activity and higher commission revenue.
Want to see what sits behind that pricing gap? Analysts are leaning on steady top line expansion, resilient margins and a richer earnings multiple a few years out. Curious which assumptions really carry this fair value story? The full narrative lays out the numbers driving that US$76.89 figure.
Result: Fair Value of $76.89 (UNDERVALUED)
However, that fair value story depends on trading activity and interest income holding up, so weaker volumes or lower rates could quickly challenge the current assumptions.
That 7.2% undervalued fair value story sits awkwardly beside how the market is actually pricing Interactive Brokers today. The shares trade on a P/E of 34.7x, compared with 25.6x for the US Capital Markets industry, 27.3x for close peers, and a fair ratio of 21.7x that our work points to.
In plain terms, the market is already assigning a richer tag than both sector and peer averages, and well above the fair ratio level it could eventually move toward. That raises a simple question for you: are you comfortable paying a premium multiple when another framework suggests the stock screens undervalued?
If you see the numbers differently or want to stress test these assumptions with your own inputs, you can build a custom view in minutes with Do it your way.
A great starting point for your Interactive Brokers Group research is our analysis highlighting 2 key rewards and 1 important warning sign that could impact your investment decision.
If you are serious about finding your next opportunity, do not stop at one stock. Use targeted screeners to quickly surface ideas that fit what you care about most.
This article by Simply Wall St is general in nature. We provide commentary based on historical data and analyst forecasts only using an unbiased methodology and our articles are not intended to be financial advice. It does not constitute a recommendation to buy or sell any stock, and does not take account of your objectives, or your financial situation. We aim to bring you long-term focused analysis driven by fundamental data. Note that our analysis may not factor in the latest price-sensitive company announcements or qualitative material. Simply Wall St has no position in any stocks mentioned.
