
Please use a PC Browser to access Register-Tadawul
Get It
A Look At Transocean (RIG) Valuation After New Offshore Contract Wins And 52 Week High
Transocean Ltd. RIG | 6.52 | +2.52% |
Transocean (NYSE:RIG) recently announced several new offshore drilling contracts, including a $120 million agreement with bp in Brazil and a $130 million project in Australia, plus further contract extensions that helped lift the stock to a 52 week high.
These contracts have arrived during a strong upswing in the share price, with a 30 day share price return of 20.34% and a 90 day share price return of 29.43%. The 1 year total shareholder return of 26.79% contrasts with a 3 year total shareholder return of negative 28.59%, highlighting short term momentum against a weaker longer term record.
If this kind of contract driven move has your attention, it could be a good moment to scout aerospace and defense stocks for other specialised operators tied to long term spending commitments.
With the shares at a 52 week high, analysts’ average price target below the current US$4.97 level and an intrinsic value estimate implying a discount, you have to ask: is there mispricing here, or is the market already baking in future growth?
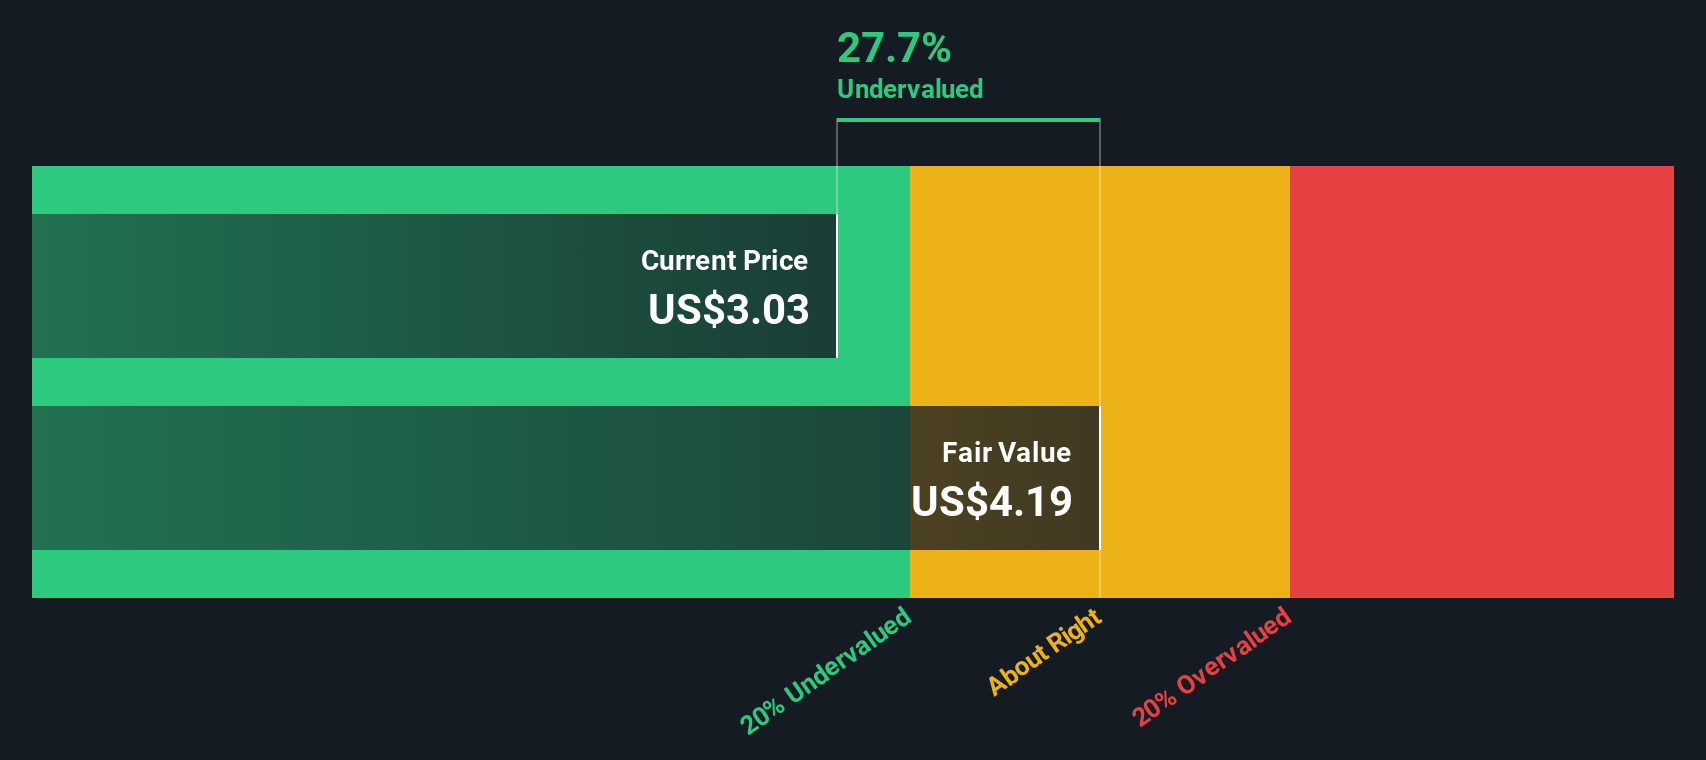
Transocean's most followed narrative pegs fair value at about $4.17 per share, which sits below the latest close at $4.97, setting up a tension between narrative models and recent price action.
Transocean's industry leading backlog (~$7 billion) with major E&P clients provides strong revenue visibility and cash flow stability, enabling efficient conversion of backlog into revenue and supporting rapid deleveraging, which will positively impact net debt levels and interest expense.
Want to see what is baked into that fair value gap? The narrative leans heavily on margin repair, a swing into profits, and a future earnings multiple that is usually reserved for higher growth stories. Curious which specific cash flow and profitability shifts have been pencilled in to support that pricing power argument?
Result: Fair Value of $4.17 (OVERVALUED)
However, that story can crack if refinancing pressure from Transocean's heavy debt or softer offshore dayrates and utilization starts to squeeze cash flow and margins.
While the most followed narrative suggests Transocean is overvalued at around $4.97 versus an estimated fair value of $4.17, our DCF model points the other way. On that cash flow view, the shares trade about 24% below an intrinsic value of roughly $6.53. This raises a simple question: which set of assumptions do you trust more?
Simply Wall St performs a discounted cash flow (DCF) on every stock in the world every day (check out Transocean for example). We show the entire calculation in full. You can track the result in your watchlist or portfolio and be alerted when this changes, or use our stock screener to discover 871 undervalued stocks based on their cash flows. If you save a screener we even alert you when new companies match - so you never miss a potential opportunity.
If this version of the story does not quite fit your view, or you would rather lean on your own work, you can build a custom thesis in just a few minutes using Do it your way.
A great starting point for your Transocean research is our analysis highlighting 2 key rewards and 2 important warning signs that could impact your investment decision.
If you stop with one stock, you miss the bigger picture. Use the Screener to spot fresh ideas and keep your watchlist working harder for you.
This article by Simply Wall St is general in nature. We provide commentary based on historical data and analyst forecasts only using an unbiased methodology and our articles are not intended to be financial advice. It does not constitute a recommendation to buy or sell any stock, and does not take account of your objectives, or your financial situation. We aim to bring you long-term focused analysis driven by fundamental data. Note that our analysis may not factor in the latest price-sensitive company announcements or qualitative material. Simply Wall St has no position in any stocks mentioned.
