
Please use a PC Browser to access Register-Tadawul
Get It
Assessing Avista (AVA) Shares: Is There More Value Ahead After 2024’s Quiet Gains?
Avista Corporation AVA | 39.87 | +1.48% |
Avista (AVA) shares have moved modestly over the past week, adding just under 2% for the month and a bit more than 5% so far in 2024. Investors may be watching for fresh catalysts that could influence the stock’s direction from this point forward.
Avista’s share price momentum has quietly built up in 2024, with a year-to-date gain of 5.3% and a total shareholder return of 7.1% over the past year. The recent uptick hints at improving sentiment, although price moves remain modest compared to some peers.
If you’re weighing what else could be gaining steam, consider expanding your search and discover fast growing stocks with high insider ownership
This steady performance raises an important question: Are Avista shares still undervalued in light of recent gains, or has the market already accounted for all of the company’s future growth potential?
Avista’s last close of $38.27 sits below the most popular narrative’s fair value estimate of $41. This gap signals investor caution despite forecasts for growth.
Robust, multi-year capital investment plans approaching $3 billion (2025 to 2029), with additional upside from grid expansion projects and new generation needs tied to large load requests, position Avista to earn regulated returns and drive long-term earnings expansion.
Curious about the math behind that valuation? The narrative hints at a rare combination: projected revenue expansion, margin improvements, and a powerful profit surge. The twist? It all hinges on a forward-looking earnings multiple that’s lower than this industry’s average. Want to see which bold assumptions underpin that price target? The full narrative reveals the numbers most investors never see.
Result: Fair Value of $41 (UNDERVALUED)
However, challenges such as localized regulatory risks and volatile clean tech investments could quickly alter Avista’s earnings outlook and weigh on growth expectations.
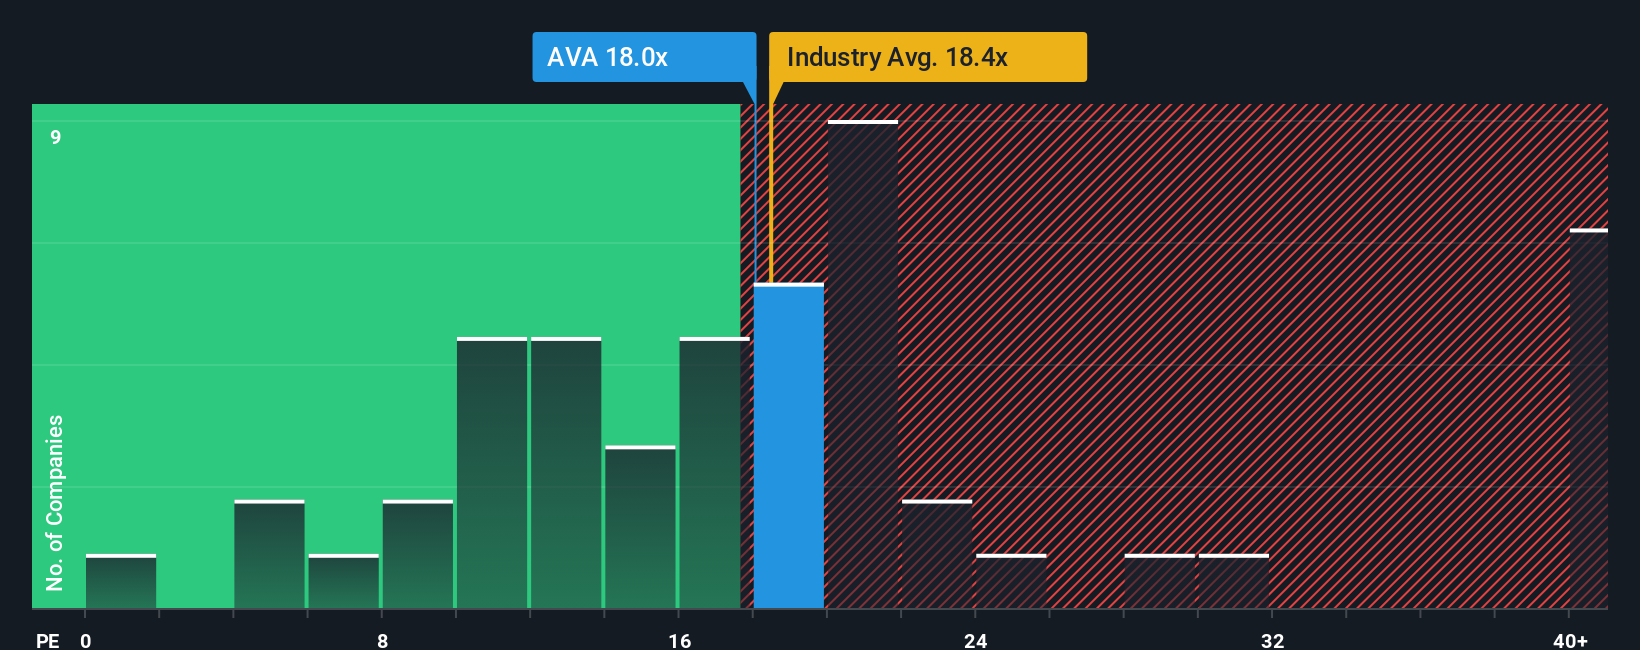
Looking beyond analyst growth narratives, Avista’s price-to-earnings ratio sits at 17.3x, which is below both the industry average of 18.3x and the peer average of 18.5x. It is also under the fair ratio estimate of 18.4x. This could signal opportunity, but the extent of the cushion it offers if market sentiment shifts remains uncertain.
Simply Wall St performs a discounted cash flow (DCF) on every stock in the world every day (check out Avista for example). We show the entire calculation in full. You can track the result in your watchlist or portfolio and be alerted when this changes, or use our stock screener to discover 849 undervalued stocks based on their cash flows. If you save a screener we even alert you when new companies match - so you never miss a potential opportunity.
If these viewpoints do not match your own or you would rather dive into the details yourself, crafting a personal narrative takes just a few minutes: Do it your way.
A great starting point for your Avista research is our analysis highlighting 3 key rewards and 2 important warning signs that could impact your investment decision.
Take charge of your financial journey by tapping into new stock opportunities that could power up your portfolio’s growth, value, and resilience this year.
This article by Simply Wall St is general in nature. We provide commentary based on historical data and analyst forecasts only using an unbiased methodology and our articles are not intended to be financial advice. It does not constitute a recommendation to buy or sell any stock, and does not take account of your objectives, or your financial situation. We aim to bring you long-term focused analysis driven by fundamental data. Note that our analysis may not factor in the latest price-sensitive company announcements or qualitative material. Simply Wall St has no position in any stocks mentioned.
