
Please use a PC Browser to access Register-Tadawul
Get It
Assessing Bilibili (BILI) Valuation After A Turn To 8% Operating Margins And Near Breakeven Profitability
BILIBILI INC. BILI | 25.20 25.11 | +1.20% -0.36% Post |
Bilibili (NasdaqGS:BILI) is back in focus after recent results showed operating margins at 8%, shifting from prior heavy losses as stronger advertising monetization and mobile gaming helped the company approach breakeven profit on roughly US$4b in revenue.
The recent swing to an 8% operating margin appears to have caught investors attention, with a 30 day share price return of 29.09% and a 1 year total shareholder return of 103.59%. However, the 5 year total shareholder return is a 75.51% loss, so momentum has shifted sharply over the shorter term.
If Bilibili has you rethinking growth stories in tech, this could be a good moment to widen your search with high growth tech and AI stocks.
With operating margins now at 8% and a recent swing in sentiment after a 103.59% 1 year return, the key question is whether Bilibili’s improved fundamentals still leave upside or if the market is already pricing in future growth.
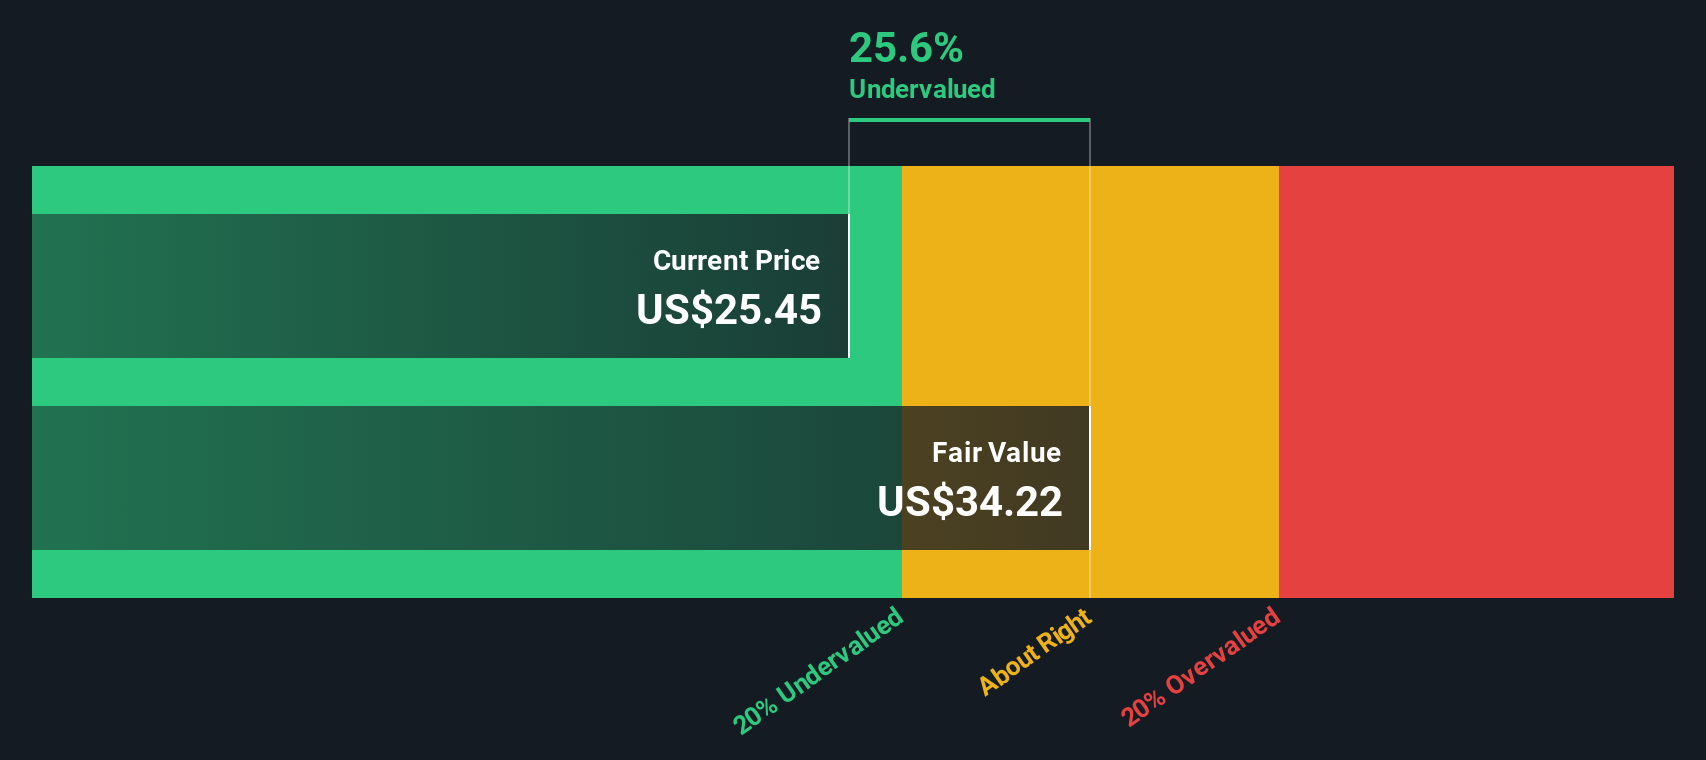
Bilibili's most followed narrative pegs fair value at $31.14, which sits below the latest close of $34.04, so the story leans toward a premium pricing.
The analysts have a consensus price target of $27.787 for Bilibili based on their expectations of its future earnings growth, profit margins and other risk factors. However, there is a degree of disagreement amongst analysts, with the most bullish reporting a price target of $37.73, and the most bearish reporting a price target of just $22.14.
Curious what earnings path could justify that outcome, and why projected margins and a rich future profit multiple still underpin this fair value? The full narrative lays out the step by step case.
Result: Fair Value of $31.14 (OVERVALUED)
However, you still have to weigh the concentrated exposure to China’s Gen Z audience and the ongoing regulatory uncertainty that could quickly change revenue, gaming plans, or margins.
While the popular narrative frames Bilibili as about 9.3% overvalued at $34.04 versus a fair value of $31.14, our DCF model lands in a different place. Using that approach, the shares sit roughly 9.4% below an estimated fair value of $37.59. This raises a simple question: which story do you trust more, earnings multiples or long term cash flows?
Simply Wall St performs a discounted cash flow (DCF) on every stock in the world every day (check out Bilibili for example). We show the entire calculation in full. You can track the result in your watchlist or portfolio and be alerted when this changes, or use our stock screener to discover 875 undervalued stocks based on their cash flows. If you save a screener we even alert you when new companies match - so you never miss a potential opportunity.
If you look at the numbers and draw a different conclusion, or simply prefer working from your own assumptions, you can build a custom view in just a few minutes, starting with Do it your way.
A great starting point for your Bilibili research is our analysis highlighting 3 key rewards and 1 important warning sign that could impact your investment decision.
If Bilibili sharpened your focus on quality growth, do not stop here. Widening your watchlist now can help you spot opportunities before they feel obvious.
This article by Simply Wall St is general in nature. We provide commentary based on historical data and analyst forecasts only using an unbiased methodology and our articles are not intended to be financial advice. It does not constitute a recommendation to buy or sell any stock, and does not take account of your objectives, or your financial situation. We aim to bring you long-term focused analysis driven by fundamental data. Note that our analysis may not factor in the latest price-sensitive company announcements or qualitative material. Simply Wall St has no position in any stocks mentioned.
