
Please use a PC Browser to access Register-Tadawul
Get It
Assessing Fastly (FSLY) Valuation After Record Q4 Earnings And Strong 2026 Guidance
Fastly, Inc. FSLY | 19.12 | +6.46% |
Fastly (FSLY) is back in focus after reporting record fourth quarter results, returning to an adjusted profit and issuing full year 2026 revenue guidance that came in well above earlier analyst expectations.
The latest results have triggered a sharp re-rating in the market, with a 1-day share price return of 13.84% and a 7-day share price return of 109.40%. The 1-year total shareholder return of 126.27% contrasts with a 5-year total shareholder return of 76.10%, suggesting momentum has recently swung back in Fastly's favor.
If Fastly's AI driven surge has caught your attention, this could be a good moment to see what else is moving in edge and AI infrastructure through our 34 AI infrastructure stocks.
With Fastly now posting record quarterly revenue, a narrower loss and bullish 2026 guidance, the stock’s rapid rebound raises a straightforward question for you: is this a fresh entry point, or is the market already pricing in that future growth?
Fastly’s fair value in the most followed narrative sits at $10.42 versus a last close of $18.26. This frames a cautious starting point for anyone eyeing the recent surge.
The analysts have a consensus price target of $7.667 for Fastly based on their expectations of its future earnings growth, profit margins and other risk factors. However, there is a degree of disagreement amongst analysts, with the most bullish reporting a price target of $10.0, and the most bearish reporting a price target of just $6.0.
Want to see why this narrative still lands above $10 per share? Revenue expectations, future margins and a punchy earnings multiple all pull in the same direction. Curious which assumptions do the heavy lifting and how long that ramp up is supposed to take? The full narrative lays out the entire earnings roadmap behind that fair value.
Result: Fair Value of $10.42 (OVERVALUED)
However, you still need to weigh up the pressure in Fastly’s core CDN business and its reliance on a small group of large customers as possible spoilers.
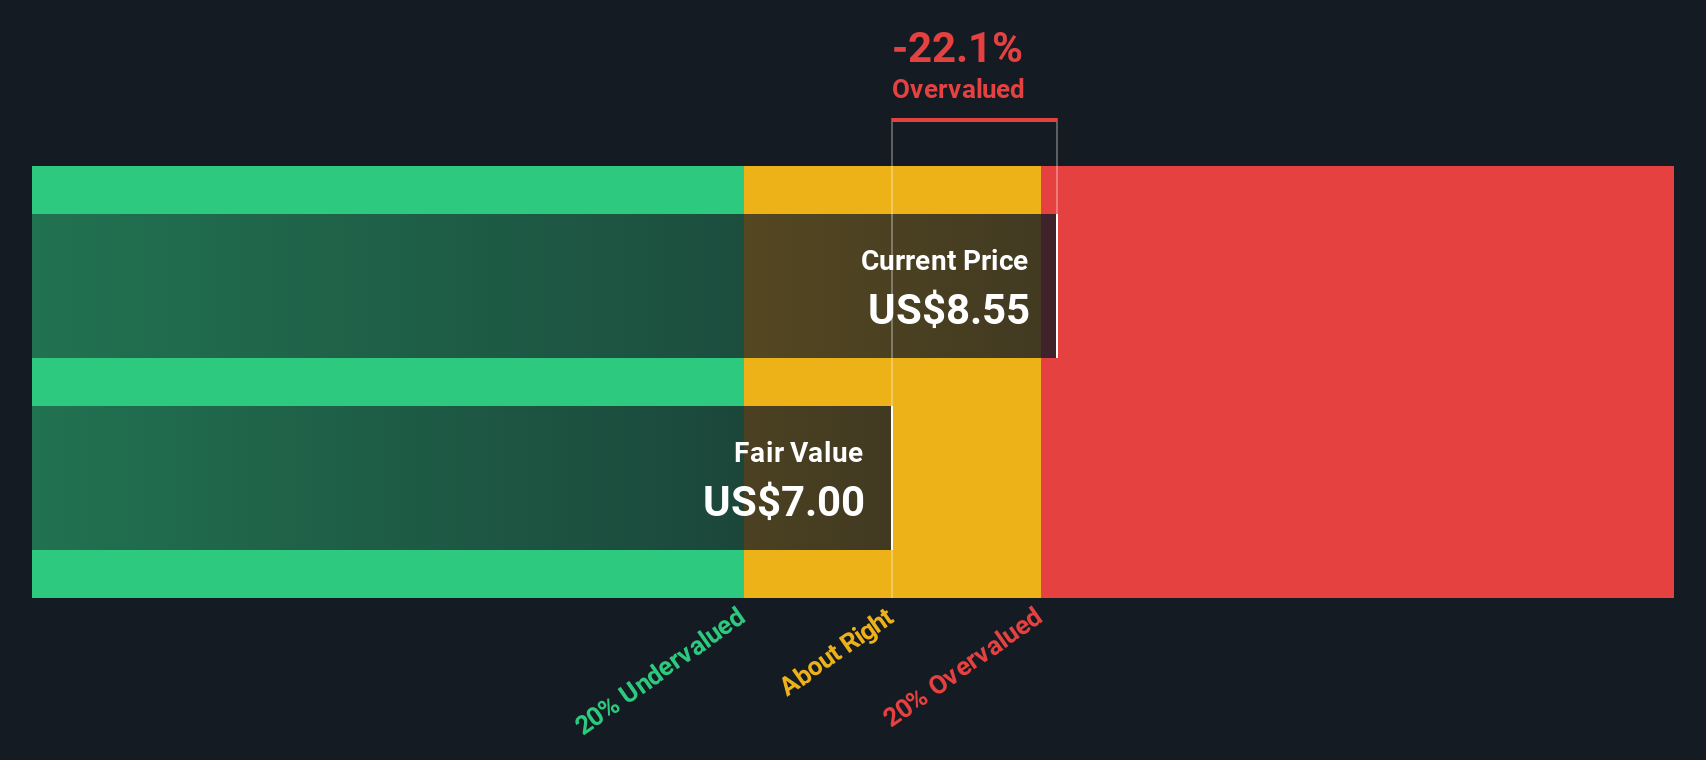
Analysts see Fastly as 75.3% overvalued versus a $10.42 fair value, yet our DCF model points to something closer to fair, with the shares trading about 2.1% below its $18.66 future cash flow value. When one approach signals potential overvaluation and another appears more balanced, which do you find more persuasive?
Simply Wall St performs a discounted cash flow (DCF) on every stock in the world every day (check out Fastly for example). We show the entire calculation in full. You can track the result in your watchlist or portfolio and be alerted when this changes, or use our stock screener to discover 54 high quality undervalued stocks. If you save a screener we even alert you when new companies match - so you never miss a potential opportunity.
If you are not fully on board with these assumptions or simply prefer to test your own, you can build and stress test a custom Fastly story in just a few minutes, then Do it your way.
A great starting point for your Fastly research is our analysis highlighting 2 key rewards and 3 important warning signs that could impact your investment decision.
If Fastly has sharpened your interest, do not stop here. Use the Simply Wall St Screener to spot other opportunities before they move without you.
This article by Simply Wall St is general in nature. We provide commentary based on historical data and analyst forecasts only using an unbiased methodology and our articles are not intended to be financial advice. It does not constitute a recommendation to buy or sell any stock, and does not take account of your objectives, or your financial situation. We aim to bring you long-term focused analysis driven by fundamental data. Note that our analysis may not factor in the latest price-sensitive company announcements or qualitative material. Simply Wall St has no position in any stocks mentioned.
