
Please use a PC Browser to access Register-Tadawul
Get It
Assessing LPL Financial Holdings (LPLA) Valuation After Recent Share Price Strength
LPL Financial Holdings Inc. LPLA | 319.22 | -2.65% |
LPL Financial Holdings (LPLA) has drawn attention after recent share price moves, with the stock last closing at $393.25. Investors are weighing this valuation against the company’s latest financial profile and return history.
The recent 1-day share price return of 2.11% and 1-month share price return of 9.29% put LPL Financial Holdings on a firmer short term footing. Multi year total shareholder returns, including 64.40% over three years and 209.64% over five years, point to sustained investor interest rather than a sudden swing in sentiment.
If this move in LPL Financial Holdings has you looking beyond a single name, it could be a good moment to scan our list of 22 top founder-led companies as potential next ideas.
With LPL trading at $393.25, an implied 5.3% discount to one intrinsic estimate and about 15% below one analyst price target, the key question is whether this represents genuine value or if the market is already pricing in future growth.
With LPL Financial Holdings last closing at $393.25 against a narrative fair value of about $448.92, the current setup depends on how durable its earnings power really is.
The demographic shift toward an aging population and rising demand for financial advisory services is expanding the addressable market for LPL, as evidenced by record total assets of $1.9 trillion and strong organic net new asset growth supporting long-term revenue growth.
Want to see what is sitting behind that fair value gap? Revenue expansion, margin assumptions, and future trading activity all play a central part. The mix really matters.
Result: Fair Value of $448.92 (UNDERVALUED)
However, there is still the risk that rate sensitive cash sweep revenues or ongoing fee compression could pressure margins and make those higher earnings assumptions look stretched.
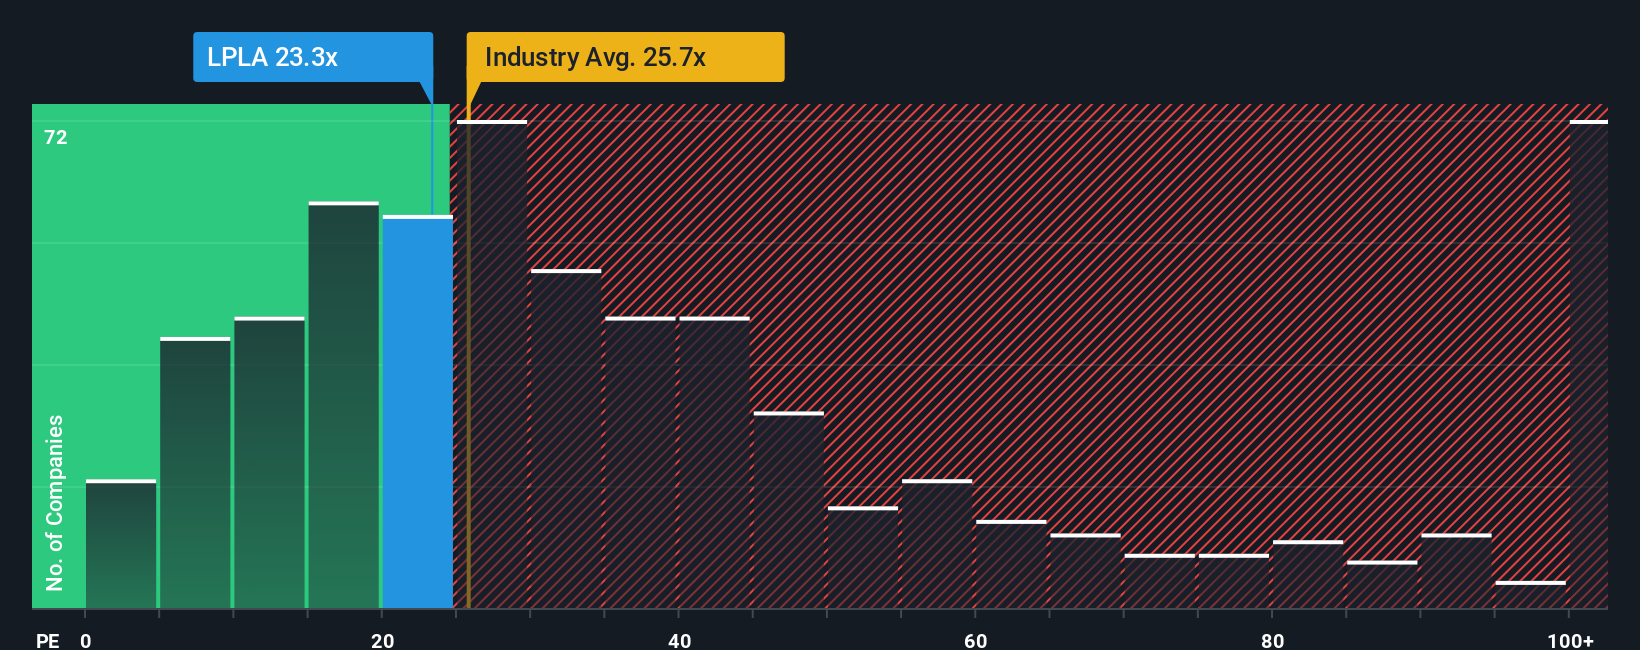
The first view leans on future cash flows, but the current P/E of 36.5x tells a different story. It sits well above the US Capital Markets industry at 23.3x and a fair ratio of 20.4x, which suggests investors are already paying up. Is that premium comfort or risk for you?
To see how that premium stacks up against the numbers, See what the numbers say about this price — find out in our valuation breakdown. can help you break down where expectations might be running hot.
For a sense of how LPL compares visually against peers on earnings multiples, take a look at
If you see the story differently or prefer to weigh the numbers yourself, you can shape your own LPL view in just a few minutes: Do it your way.
A great starting point for your LPL Financial Holdings research is our analysis highlighting 2 key rewards and 3 important warning signs that could impact your investment decision.
If you stop with just one company, you risk missing opportunities that better fit your goals, so use the Simply Wall St Screener to widen your options.
This article by Simply Wall St is general in nature. We provide commentary based on historical data and analyst forecasts only using an unbiased methodology and our articles are not intended to be financial advice. It does not constitute a recommendation to buy or sell any stock, and does not take account of your objectives, or your financial situation. We aim to bring you long-term focused analysis driven by fundamental data. Note that our analysis may not factor in the latest price-sensitive company announcements or qualitative material. Simply Wall St has no position in any stocks mentioned.
