
Please use a PC Browser to access Register-Tadawul
Get It
Assessing MGM Resorts (MGM) Valuation After Las Vegas Strip Gaming Revenue Declines And Balance Sheet Concerns
MGM Resorts International MGM | 36.68 | +1.05% |
Recent data showing a second consecutive month of Las Vegas Strip gross gaming revenue declines is drawing attention to MGM Resorts International (MGM) because of its heavy Strip exposure, leveraged balance sheet, and distress-zone Altman Z-Score.
The recent Las Vegas Strip revenue softness and MGM's balance sheet risks come against a mixed price backdrop, with a 30 day share price return of an 8.08% decline contrasting with a 90 day gain of 4.39%. The 1 year total shareholder return of a 2.73% decline and 3 year total shareholder return of a 19.59% decline suggest longer term momentum has been fading, despite interest around its renewable energy commitments and Strip exposure.
If you are weighing MGM's risk profile against other opportunities, this could be a useful moment to scan fast growing stocks with high insider ownership and see which companies insiders are backing more heavily.
With Las Vegas gaming revenue under pressure, a leveraged balance sheet and an intrinsic discount of about 41% to some fair value estimates, investors now face the key question: is MGM undervalued or is the market already pricing in its future growth?
With MGM Resorts International last closing at $33.54 versus a most-followed fair value estimate of about $42.56, the narrative focuses heavily on long term projects and capital flexibility to explain the gap.
The development and opening of international integrated resorts, specifically the exclusive license in MGM Osaka, anticipated multibillion-dollar revenue potential, and Dubai project, should capture rising demand for destination travel among the growing global middle class, unlocking new recurring revenue streams and diversifying consolidated earnings over the long term.
Curious what earnings power and margin profile are baked into that view, or how long it could take before those projects really matter? The narrative spells out a detailed path for revenue, profitability and valuation multiples that goes well beyond the headline price gap.
Result: Fair Value of $42.56 (UNDERVALUED)
However, there are still clear pressure points, including weaker Las Vegas visitation trends and heavy, long dated project commitments that could strain cash flow if conditions remain soft.
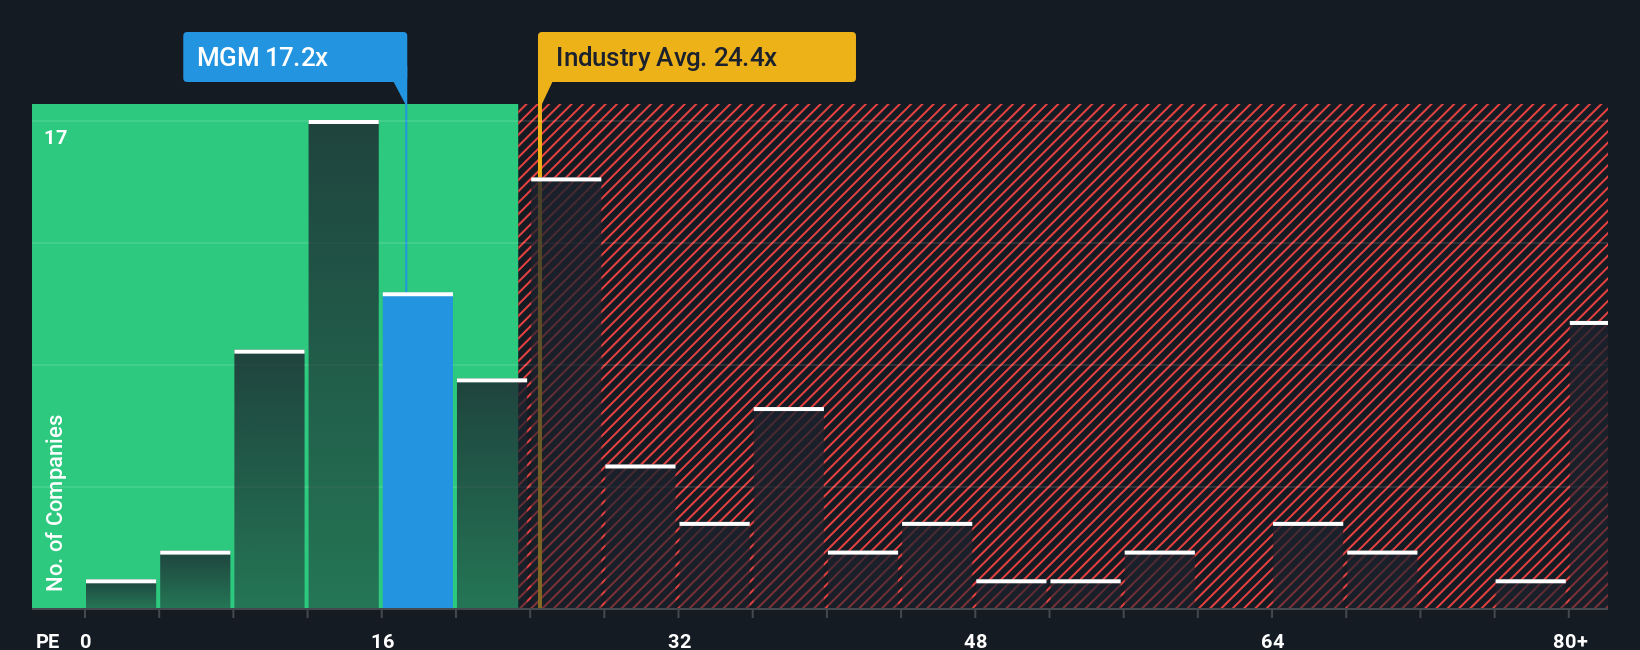
While our DCF model points to MGM trading at roughly a 41.3% discount to an estimated fair value of $57.15, the P/E story looks very different. MGM trades on a P/E of 136.6x versus a peer average of 15.5x and a fair ratio of 38.9x, which suggests the market is already baking in a lot of future earnings power. For you, that tension between cash flow upside and an elevated earnings multiple raises a simple question: which signal do you trust more?
If you look at the numbers and reach a different conclusion, or simply want to test your own assumptions against the data, you can build a personalized MGM story from scratch in just a few minutes using Do it your way.
A great starting point for your MGM Resorts International research is our analysis highlighting 2 key rewards and 3 important warning signs that could impact your investment decision.
If MGM is only one piece of your watchlist, this is the moment to broaden your scope and put more potential opportunities on your radar.
This article by Simply Wall St is general in nature. We provide commentary based on historical data and analyst forecasts only using an unbiased methodology and our articles are not intended to be financial advice. It does not constitute a recommendation to buy or sell any stock, and does not take account of your objectives, or your financial situation. We aim to bring you long-term focused analysis driven by fundamental data. Note that our analysis may not factor in the latest price-sensitive company announcements or qualitative material. Simply Wall St has no position in any stocks mentioned.
