
Please use a PC Browser to access Register-Tadawul
Get It
Assessing Stock Yards Bancorp (SYBT) Valuation After Strong Earnings Beat And Loan Growth
Stock Yards Bancorp, Inc. SYBT | 69.33 | +1.46% |
Stock Yards Bancorp (SYBT) moved into focus after reporting double-digit revenue growth, beating analyst expectations and posting its sixth consecutive quarter of loan growth across all markets, with the share price edging higher since the update.
The latest earnings update and the move in Nasdaq futures have gone hand in hand with improving momentum, with a 7 day share price return of 3.80% and a year to date share price return of 6.57%, even though the 1 year total shareholder return is down 8.76% and the 5 year total shareholder return stands at 61.20%.
If this has you looking beyond a single regional bank, it could be a good moment to scan for other financial names with staying power and check out our 22 top founder-led companies.
With earnings per share, intrinsic value estimates and analyst targets all pointing in different directions, the key question is whether Stock Yards Bancorp still trades at a discount or if the market is already pricing in future growth.
Stock Yards Bancorp trades on a P/E of 14.6x, which puts the current $69.49 share price above both its industry and peer benchmarks.
The P/E ratio tells you how much investors are paying today for each dollar of earnings, which matters a lot for a profitable regional bank. With earnings growth of 22.4% over the past year and high quality earnings flagged, the market appears willing to put a richer tag on those profits.
That said, the 14.6x P/E sits above the US Banks industry average of 12x, the peer average of 14.2x, and the estimated fair P/E of 12.3x. These comparisons suggest investors are currently paying a premium compared to where similar banks trade and where the SWS fair ratio indicates the multiple could gravitate over time.
Result: Price-to-earnings of 14.6x (OVERVALUED)
However, a premium P/E with a 36.79% intrinsic discount and an 8.76% one-year total return decline could limit upside if sentiment or earnings expectations cool.
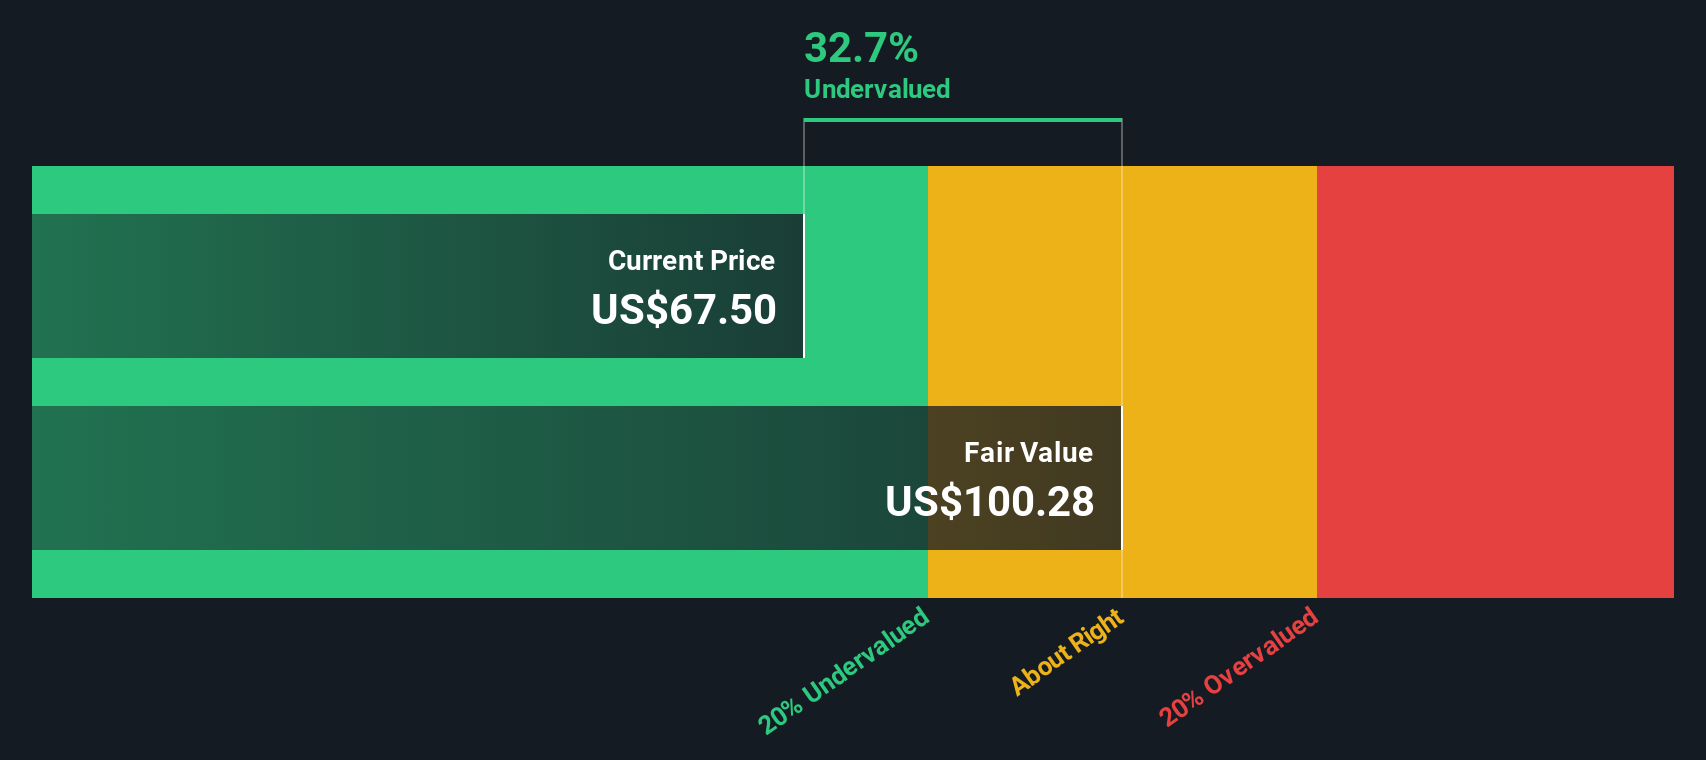
While the P/E screen makes Stock Yards Bancorp look expensive, our DCF model tells a different story. In that framework, the shares at $69.49 sit around 36.8% below an estimated future cash flow value of $109.92. This comparison frames the current price as potentially undervalued. Which lens do you trust more for a bank like this?
Simply Wall St performs a discounted cash flow (DCF) on every stock in the world every day (check out Stock Yards Bancorp for example). We show the entire calculation in full. You can track the result in your watchlist or portfolio and be alerted when this changes, or use our stock screener to discover 55 high quality undervalued stocks. If you save a screener we even alert you when new companies match - so you never miss a potential opportunity.
If parts of this story do not sit right with you, or you prefer to work from your own numbers, you can pull the figures, stress test your assumptions and shape a personalised Stock Yards Bancorp view in just a few minutes with Do it your way.
A good starting point is our analysis highlighting 4 key rewards investors are optimistic about regarding Stock Yards Bancorp.
If this update has sharpened your thinking, do not stop at one bank, use the tools available and line up your next round of opportunities with confidence.
This article by Simply Wall St is general in nature. We provide commentary based on historical data and analyst forecasts only using an unbiased methodology and our articles are not intended to be financial advice. It does not constitute a recommendation to buy or sell any stock, and does not take account of your objectives, or your financial situation. We aim to bring you long-term focused analysis driven by fundamental data. Note that our analysis may not factor in the latest price-sensitive company announcements or qualitative material. Simply Wall St has no position in any stocks mentioned.
