
Please use a PC Browser to access Register-Tadawul
Get It
Assessing XPEL (XPEL) Valuation After Q3 Revenue Beat And Margin Expansion Plans
XPEL, Inc. XPEL | 38.46 38.46 | +1.29% 0.00% Post |
Recent attention on XPEL (XPEL) stems from its Q3 results, where revenue growth surpassed expectations while earnings per share came in below forecasts. This has prompted investors to reassess the trade off between sales momentum and profitability.
At a share price of $54.63, XPEL has climbed sharply in recent months, with a 90 day share price return of 61.18% and a 1 year total shareholder return of 39.35%. This suggests that momentum has picked up following the Q3 revenue surprise.
If XPEL’s recent move has you looking wider across autos, this could be a good moment to scan auto manufacturers for other names showing interesting trends.
With XPEL trading at $54.63, slightly above a US$52.00 analyst target and flagged with a low value score of 2 but a quoted 55% intrinsic discount, you have to ask: is there still mispricing here, or is the market already baking in future growth?
With XPEL last closing at $54.63 versus a narrative fair value of about $52.00, the current price sits slightly above that framework.
The company outlined a plan to invest $75 million to $150 million over the next two years in manufacturing and supply chain, with a stated target of gross margin of 52% to 54% and operating margins in the mid to high 20% range by the end of 2028.
Curious how those margin goals, paired with double digit revenue growth assumptions and a specific future P/E, are stitched together into that fair value? The tension between higher profitability targets, a slightly higher discount rate, and a modestly lower future earnings multiple is doing all the heavy lifting in this narrative. Want to see exactly how those moving parts balance out over the next few years?
Result: Fair Value of $52 (OVERVALUED)
However, this hinges on XPEL keeping pricing power and aftermarket demand intact, while competition from lower cost manufacturers and potential OEM bypass both remain real swing factors.
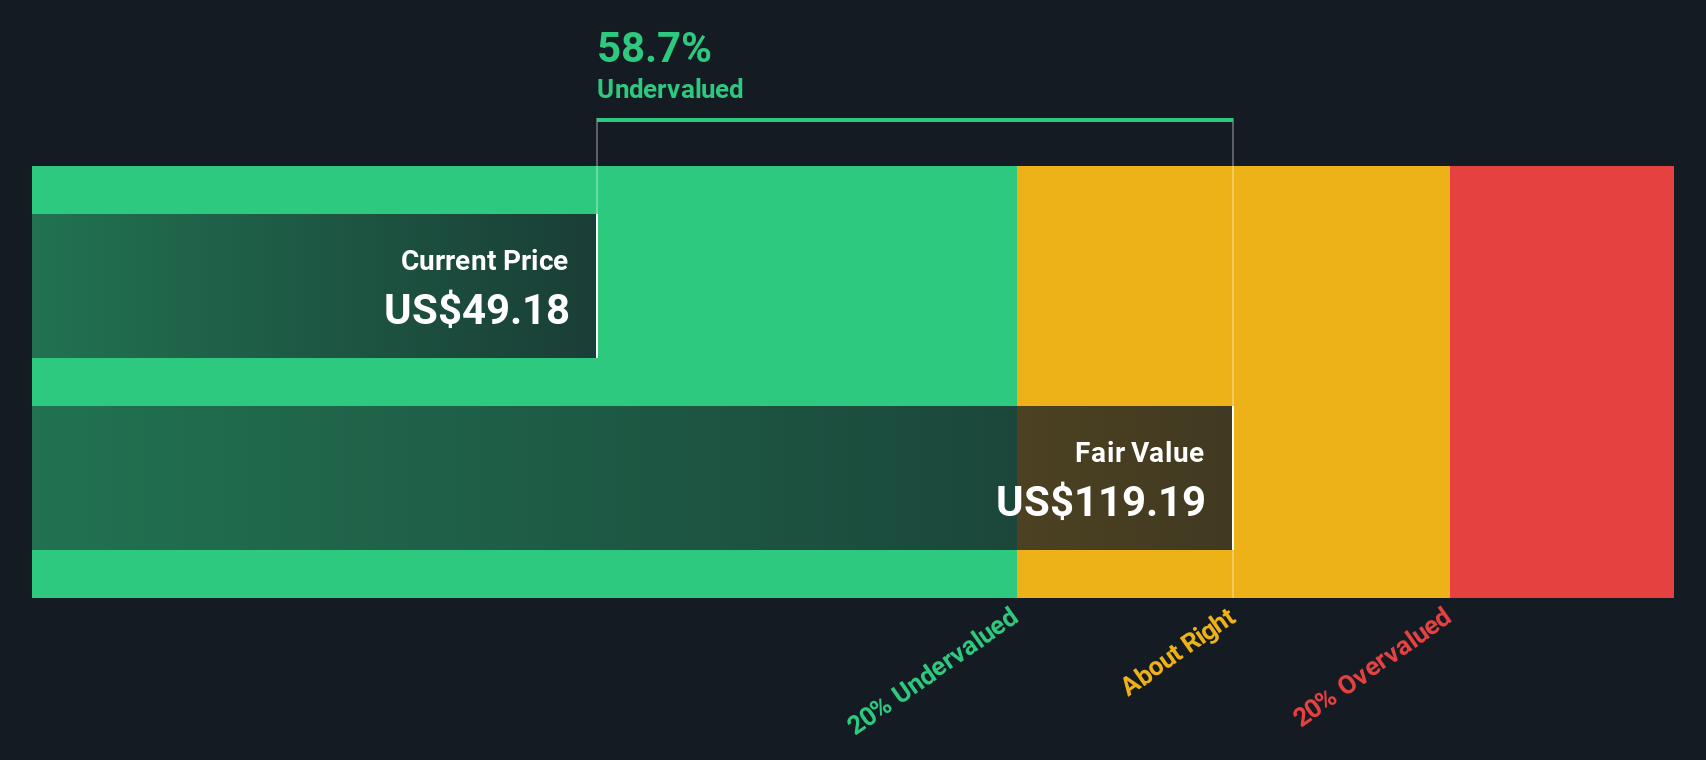
Analysts see XPEL as about 5% overvalued versus a US$52.00 fair value, but our DCF model tells a very different story, suggesting the shares trade about 55% below an estimated fair value of roughly US$121.01. These two methods produce very different answers, so which one do you trust more?
Simply Wall St performs a discounted cash flow (DCF) on every stock in the world every day (check out XPEL for example). We show the entire calculation in full. You can track the result in your watchlist or portfolio and be alerted when this changes, or use our stock screener to discover 876 undervalued stocks based on their cash flows. If you save a screener we even alert you when new companies match - so you never miss a potential opportunity.
If you see the numbers differently or prefer to stress test your own assumptions, you can create a custom view in minutes, Do it your way.
A good starting point is our analysis highlighting 2 key rewards investors are optimistic about regarding XPEL.
If XPEL has sparked your curiosity, do not stop here; broaden your watchlist now so you are not looking back wishing you had checked sooner.
This article by Simply Wall St is general in nature. We provide commentary based on historical data and analyst forecasts only using an unbiased methodology and our articles are not intended to be financial advice. It does not constitute a recommendation to buy or sell any stock, and does not take account of your objectives, or your financial situation. We aim to bring you long-term focused analysis driven by fundamental data. Note that our analysis may not factor in the latest price-sensitive company announcements or qualitative material. Simply Wall St has no position in any stocks mentioned.
