
Please use a PC Browser to access Register-Tadawul
Get It
Breakthrough And Pullback | US Stocks Plunge! But These Strong Stocks Deserve Close Attention: CORT, COOP And More
Corcept Therapeutics CORT | 87.99 | +0.99% |
Mr. Cooper Group Inc. - Common Stock COOP | 210.79 | Delist |
Aeva Technologies, Inc. AEVA | 16.01 | -6.48% |
IHS Holding Limited IHS | 7.35 | -4.79% |
S&P 500 index SPX | 6827.41 | -1.07% |
Finding Bullish Stocks Breaking Out in the Market Every Day
Updated on 7/04/2025, US Market Index Rating: 47.31↓/D
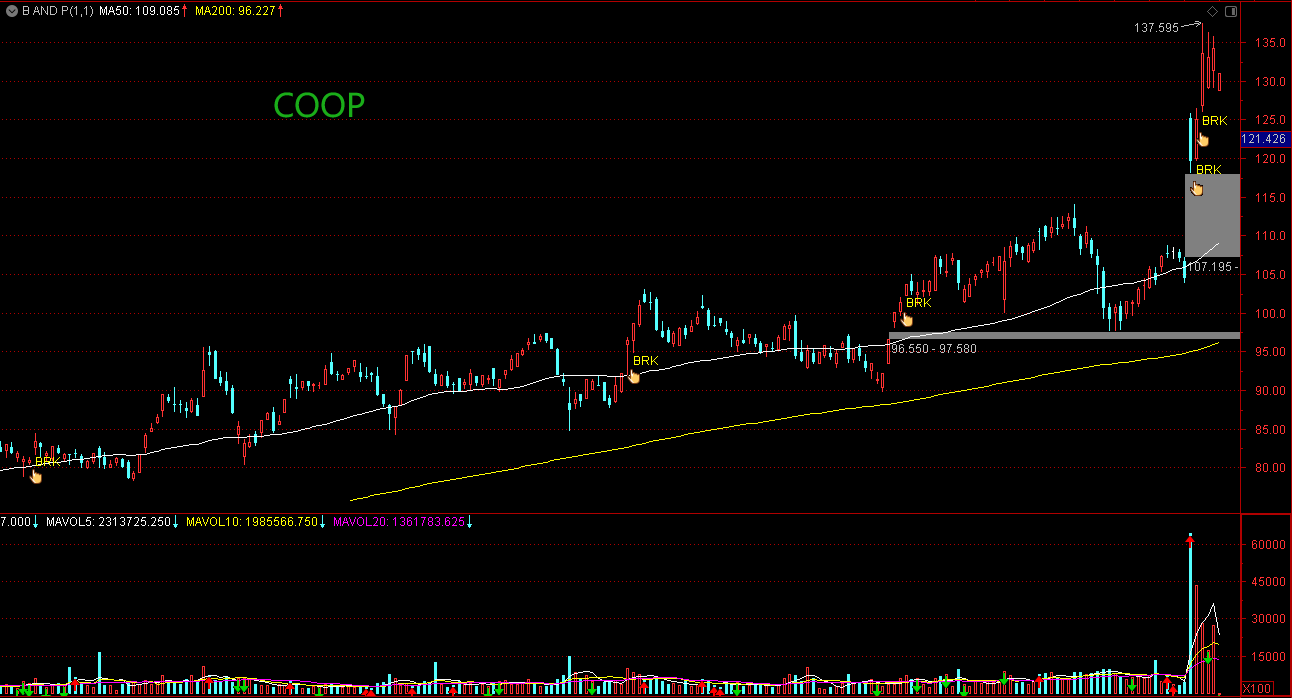
'BRK' Means 'Breakthrough', 'PBK' Means 'Pullback'; The White Line Refers to MA50, And The Yellow Line Refers to MA200
The table is sorted by composite score, which theoretically ranges from 0 to 100. Typically, we primarily focus on stocks with scores greater than 70.
Note that some of stocks have high technical pattern scores, but the fundamental scores are relatively moderate, so the overall score has not exceeded 70. Keep an eye on the company's fundamental dynamics.
More Trading Strategies in the 'Seeking 10-Baggers' Special Feature >>
| Code | Composite Score | RPS(MAX) | Earnings Rating | Buy/Sell Rating | Technical |
| Corcept Therapeutics Incorporated.(CORT.US) | 88.04 | 98.884 | 86.59 | 39.7 | P |
| Mr. Cooper Group Inc. - Common Stock(COOP.US) | 76.54 | 97.959 | 50.39 | 74 | P |
| Aeva Technologies, Inc. (AEVA.US) | 66.65 | 98.966 | 18.01 | 99.7 | P |
| IHS Holding Limited(IHS.US) | 62.40 | 97.905 | 10.83 | 91.2 | P |
Note: The composite score in the table is calculated by our quantitative team, which combines factors such as RPS, EPS, SMR, Buy/Sell, and technical indicators using different weights. The RPS (max) utilizes the maximum value among the RPS50/120/250 parameters. The Earnings Rating considers the growth rate of the stock's EPS and Sales Growth, Profit Margins, and Return on Equity ratios. The Buy/Sell Rating is calculated based on the stock's price movement and trading volume, representing the recent buying and selling strength of the stock. The Technical aspect pertains to the stock price pattern, with "P" indicating Pullback and "B" indicating Breakthrough.
Our daily stock selection column mainly focuses on stocks that have just experienced a technical breakthrough or have recently retraced to important moving averages(MA50/MA20) after a breakthrough.
In our selection strategy, "Relative Price Strength (RPS)" is the most crucial indicator. Additionally, we have included financial data as a stock selection factor. Even during a stock price retracement, we still have certain requirements for RPS (not lower than 80). Simply put, the RPS value ranges from 0 to 100. The higher the RPS, the stronger the stock's performance.
Broad Market Index
According to our quantitative scoring system, we will continuously update the Market Sentiment index for the past seven trading days in our articles. If you wish to view data from earlier periods, you can refer to our previous articles.
| DATE | 04/04 | 02/04 | 01/04 | 31/03 | 28/03 | 27/03 | 26/03 |
| S&P 500 index(SPX.US) | 48.99 | 51.4 | 51.8 | 52.2 | 51.4 | 50.6 | 49.195 |
| NASDAQ(IXIC.US) | 48.99 | 50.2 | 49.4 | 48.6 | 47.8 | 47 | 45.595 |
| Dow Jones Industrial Average(DJI.US) | 52.79 | 55.2 | 54.8 | 53.5 | 52.2 | 50.9 | 48.995 |
| Russell Midcap Index Ishares(IWR.US) | 46.89 | 51.8 | 52.6 | 53 | 52.2 | 51.4 | 49.995 |
| Russell 2000 ETF(IWM.US) | 38.89 | 41.8 | 42.6 | 44 | 44.2 | 44.4 | 43.995 |
| Average Score | 47.31↓ | 50.08↓ | 50.24↓ | 50.26↑ | 49.56↑ | 48.86↑ | 47.56↑ |
| Market Degree | D | D | D | D | D | D | D |
Note: Our quantitative team scores market indices based on objective technical indicators (such as moving averages, MACD, and other factors). We select various market indices to represent the trends of stocks in different markets, and then take the average to obtain a composite index (market sentiment). Based on the score differences, we categorize the market into different stages, representing different market sentiments: S [95, 100], A [85, 95), B [75, 85), C [60, 75), D [0, 60). For reference only.
Risk Warning: It must be noted that some of the stocks selected showed a breakout trend with increased trading volume, with experiencing significant gains. Consequently, there may be a risk of a short-term pullback. Being patient and waiting for a "suitable" buying point may be a better choice.
Note: This content was generated by Sahm content team's quant analysis model and reviewed by our editors. The stock selection in this article is based primarily on market data and quantitative calculations, without including any subjective opinions.
Disclaimer: The content is provided as general information only and should not be taken as investment advice. All the contents shall not be taken as a recommendation to buy or sell any security or financial instruments. Any action you take resulting from information, analysis, or commentary on this article is your responsibility. Please consult your investment advisor before making any investments.
