Calix (CALX) has capped FY 2025 with Q4 revenue of US$272.4 million and basic EPS of US$0.11, while trailing twelve month revenue sat at US$1.0 billion and EPS at US$0.27 as the business moved from loss to profit over the year. The company has seen revenue progress from US$206.1 million in Q4 2024, with a basic EPS loss of US$0.27, to US$272.4 million in Q4 2025 and positive EPS of US$0.11. This was accompanied by a swing in trailing twelve month EPS from a loss of US$0.45 in Q4 2024 to a profit of US$0.27, setting up this result as part of a broader profitability shift. With that backdrop, investors are likely to focus on how sustainably margins have firmed rather than just the latest quarter’s headline numbers.
See our full analysis for Calix.
With the headline figures on the table, the next step is to see how this move into profitability lines up with the key market and community narratives around Calix’s growth potential and risk profile.
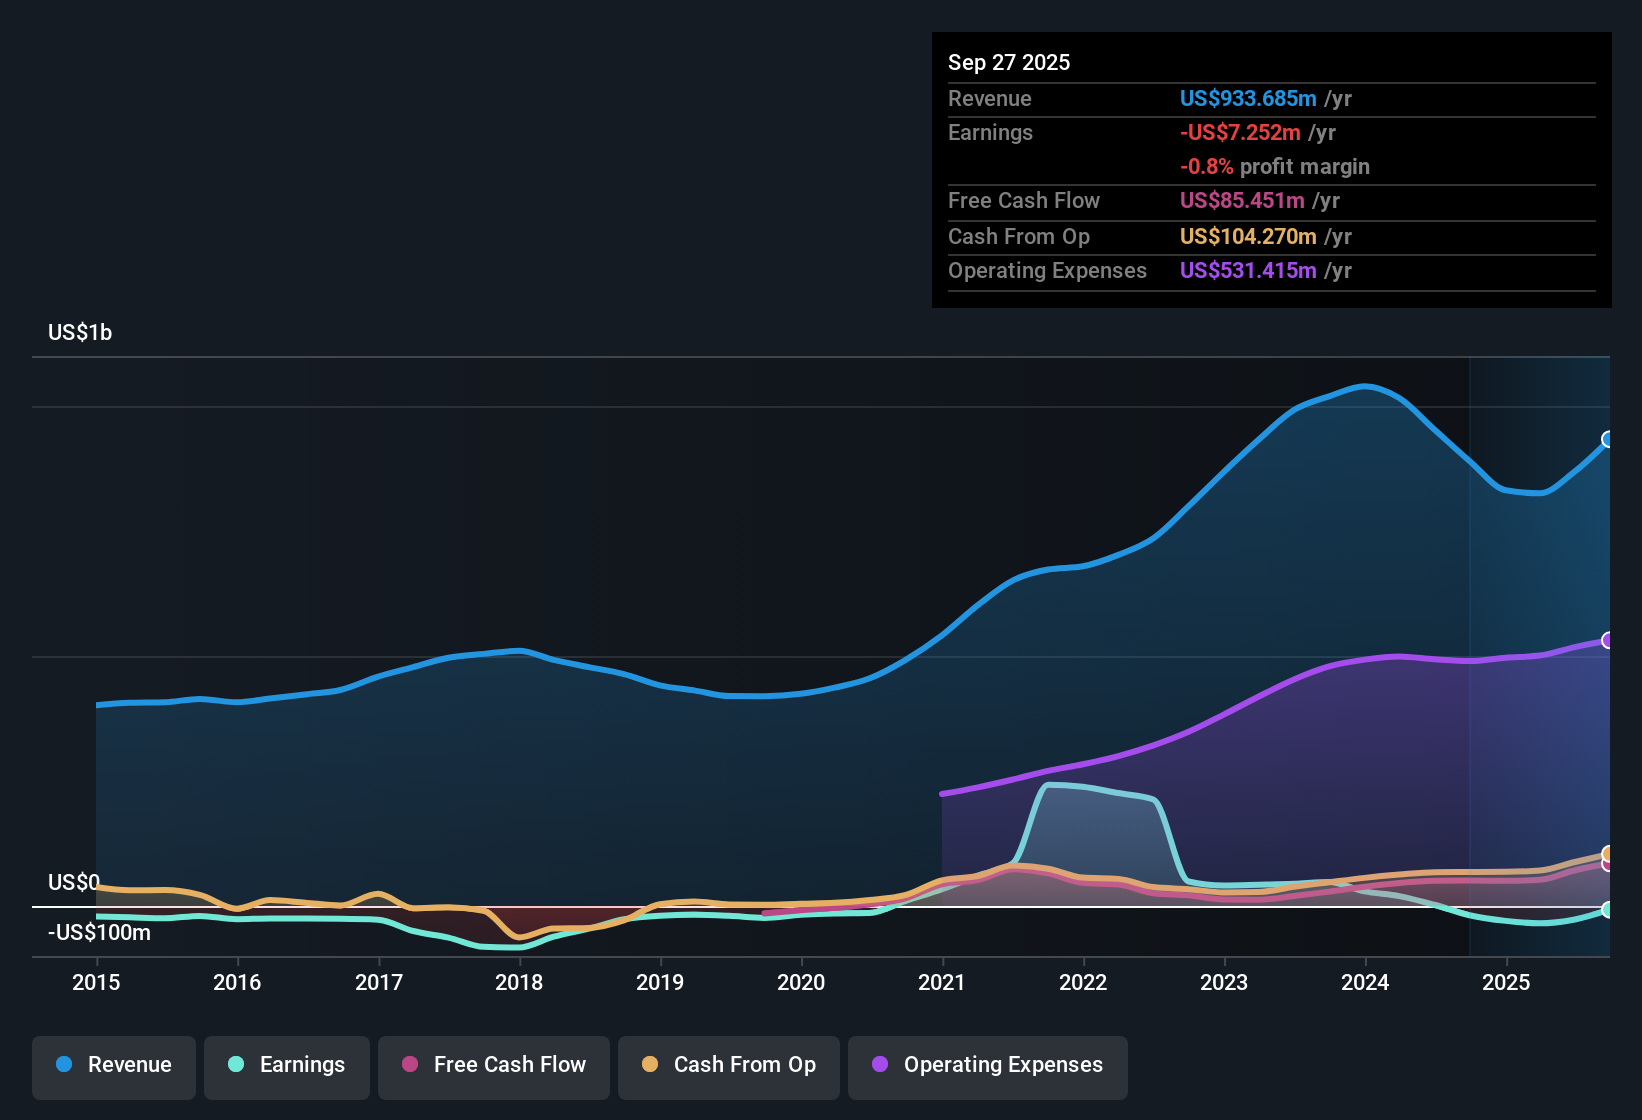
NYSE:CALX Earnings & Revenue History as at Jan 2026
TTM profit of US$17.9 million after prior losses
On a trailing twelve month basis to Q4 2025, Calix reported net income of US$17.9 million and basic EPS of US$0.27, compared with a trailing loss of US$29.7 million and EPS loss of US$0.45 one year earlier.
What stands out for a bullish view is that this move into profit came alongside TTM revenue of roughly US$1.0b, while the five year earnings trend still shows an annual decline of about 53.4%. As a result:
Supporters can point to the shift from a TTM loss of US$29.7 million to a profit of US$17.9 million as evidence that the model scaled at higher revenue levels.
At the same time, the history of earnings falling about 53.4% a year over five years gives bears a clear data point that longer term performance has been weak even with the recent turnaround.
Quarterly swings show 2025 as a transition year
Across FY 2025, quarterly EPS moved from a loss of US$0.07 in Q1 2025 and roughly breakeven in Q2, to profits of US$0.24 in Q3 and US$0.11 in Q4, while quarterly revenue ranged between US$220.2 million and US$272.4 million over the same period.
What is interesting for a cautious take is that this step into profitability came with some lumpiness, as:
Net income moved from a loss of US$4.8 million in Q1 2025 and a small loss of US$0.2 million in Q2 to profits of US$15.7 million in Q3 and US$7.2 million in Q4. This means the latest quarter profit is lower than Q3 even with slightly higher revenue.
Looking back to Q4 2024 and Q3 2024, when net income was a loss of US$17.9 million and US$4.0 million on revenue just over US$200 million, skeptics may argue that the path to consistent profitability is still a work in progress rather than a straight line.
Premium P/S against peers with DCF value at US$108.67
Calix trades on a P/S of 3.1x compared with 2.0x for the US Communications industry and 2.3x for peers, while a DCF fair value of US$108.67 is materially above the current share price of US$46.66.
That mix of higher multiple and higher modelled value gives both bulls and bears numbers to work with, because:
Supporters can point out that analysts see earnings growing around 65.4% a year with revenue around 14.2% a year, and that the DCF fair value of US$108.67 is more than double the current US$46.66 price. This supports a bullish case focused on growth and cash flows.
Critics highlight that the 3.1x P/S is above both industry and peer averages even after a five year earnings decline of about 53.4% a year, which supports a bearish concern that the stock is already priced at a premium compared with many communications names.
To see how these numbers fit into a fuller story about Calix's future growth, risks, and valuation, check out the wider narrative investors are building around the company.
📊 Read the full Calix Consensus Narrative.
Next Steps
Don't just look at this quarter; the real story is in the long-term trend. We've done an in-depth analysis on Calix's growth and its valuation to see if today's price is a bargain. Add the company to your watchlist or portfolio now so you don't miss the next big move.
Explore Alternatives
Calix’s return to profit still comes with uneven quarterly earnings and a history of TTM earnings falling about 53.4% a year over five years.
If that choppiness makes you cautious, use our CTA_SCREENER_STABLE_GROWTH to focus on companies with steadier revenue and earnings and see options that may feel more predictable.
This article by Simply Wall St is general in nature. We provide commentary based on historical data and analyst forecasts only using an unbiased methodology and our articles are not intended to be financial advice. It does not constitute a recommendation to buy or sell any stock, and does not take account of your objectives, or your financial situation. We aim to bring you long-term focused analysis driven by fundamental data. Note that our analysis may not factor in the latest price-sensitive company announcements or qualitative material. Simply Wall St has no position in any stocks mentioned.