
Please use a PC Browser to access Register-Tadawul
Get It
Can Carlyle’s Strong 2025 Gains Continue After Recent Strategy Update?
Carlyle Group Inc CG | 52.41 | +0.81% |
If you have been following Carlyle Group’s stock lately, you might be trying to figure out your next move. The shares currently sit at $63.35, and despite a slight dip of -2.4% over the past week, the bigger picture tells a different story. Year-to-date, Carlyle is up a remarkable 24.9% and has climbed an impressive 39.1% over the past year, easily outpacing broader markets. Looking at a longer timeframe, the five-year gain stands at 176.5%, highlighting a long-term surge that is difficult to ignore.
Much of this sustained upside has come amidst market shifts that have increasingly favored alternative asset managers. As more investors seek diversification away from traditional equities and bonds, big players like Carlyle have seen demand for their expertise grow. This shift has altered the risk narrative for the company and has helped to fuel share price momentum over the long haul, even as the short-term numbers occasionally wobble, as they have this month.
Before making any decision, it is important to know whether the stock is still a smart buy at current prices. The value score can be a good starting point. With a score of 3 out of 6 possible undervalued checks, Carlyle appears attractively priced in a few areas but does not signal a clear-cut bargain. That calls for a closer look at how valuation is measured, which is exactly what we will dig into next. Just as important, there may be an even better perspective to consider at the end of the article.
The Excess Returns valuation model estimates the value of Carlyle Group by measuring the company's ability to generate returns above its cost of equity. This approach calculates the difference between what the company's equity earns and what it would need to earn to compensate investors for risk, placing strong emphasis on return on invested capital and growth prospects.
For Carlyle Group, the model utilizes a Book Value of $16.33 per share and a Stable EPS of $3.58 per share, derived from a weighted average of future Return on Equity estimates provided by four analysts. The estimated Cost of Equity stands at $1.53 per share, with the resulting Excess Return at $2.05 per share. Carlyle’s average Return on Equity is a notable 21.92%, suggesting the company is efficiently generating returns on shareholders’ funds. These figures are grounded in a stable book value, once again at $16.33 per share, based on the median value reported over the past five years.
Using these metrics, the Excess Returns model calculates an intrinsic value of $49.01 per share for Carlyle Group. With shares currently trading at $63.35, this implies the stock is approximately 29.3% overvalued according to this framework. Investors should be cautious at these levels, as the price exceeds what fundamental returns currently support.
Result: OVERVALUED
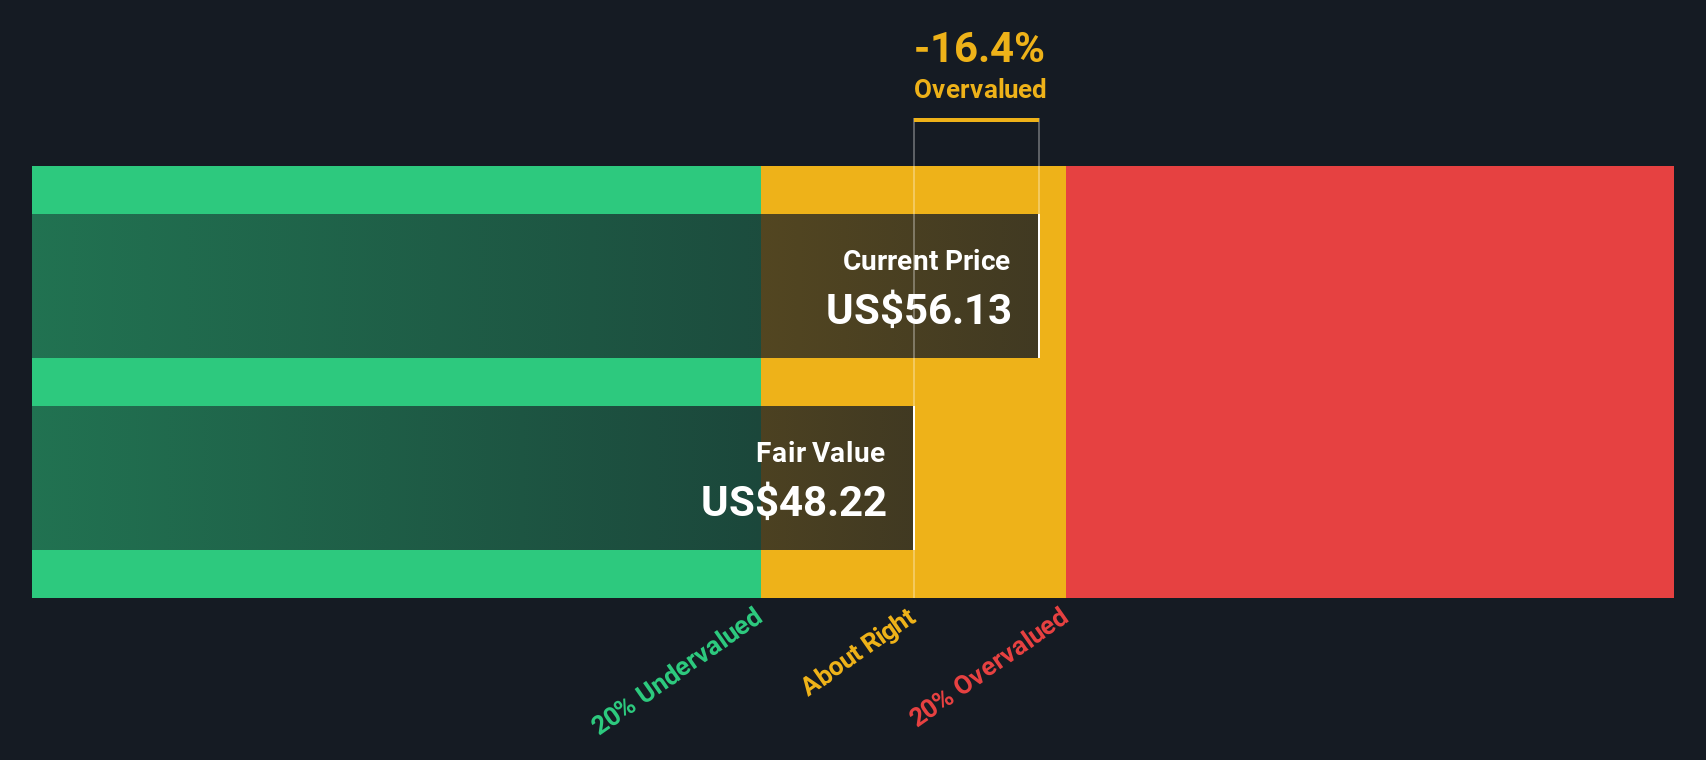
Our Excess Returns analysis suggests Carlyle Group may be overvalued by 29.3%. Find undervalued stocks or create your own screener to find better value opportunities.
The Price-to-Earnings (PE) ratio is a well-established metric for valuing profitable companies like Carlyle Group, as it links a company’s current share price to its per-share earnings. This makes it a reliable tool for investors looking to assess whether a stock is priced reasonably based on its ability to generate profits. Higher growth expectations or lower risk often justify a higher PE ratio, while slower growth or higher risk warrants a lower one.
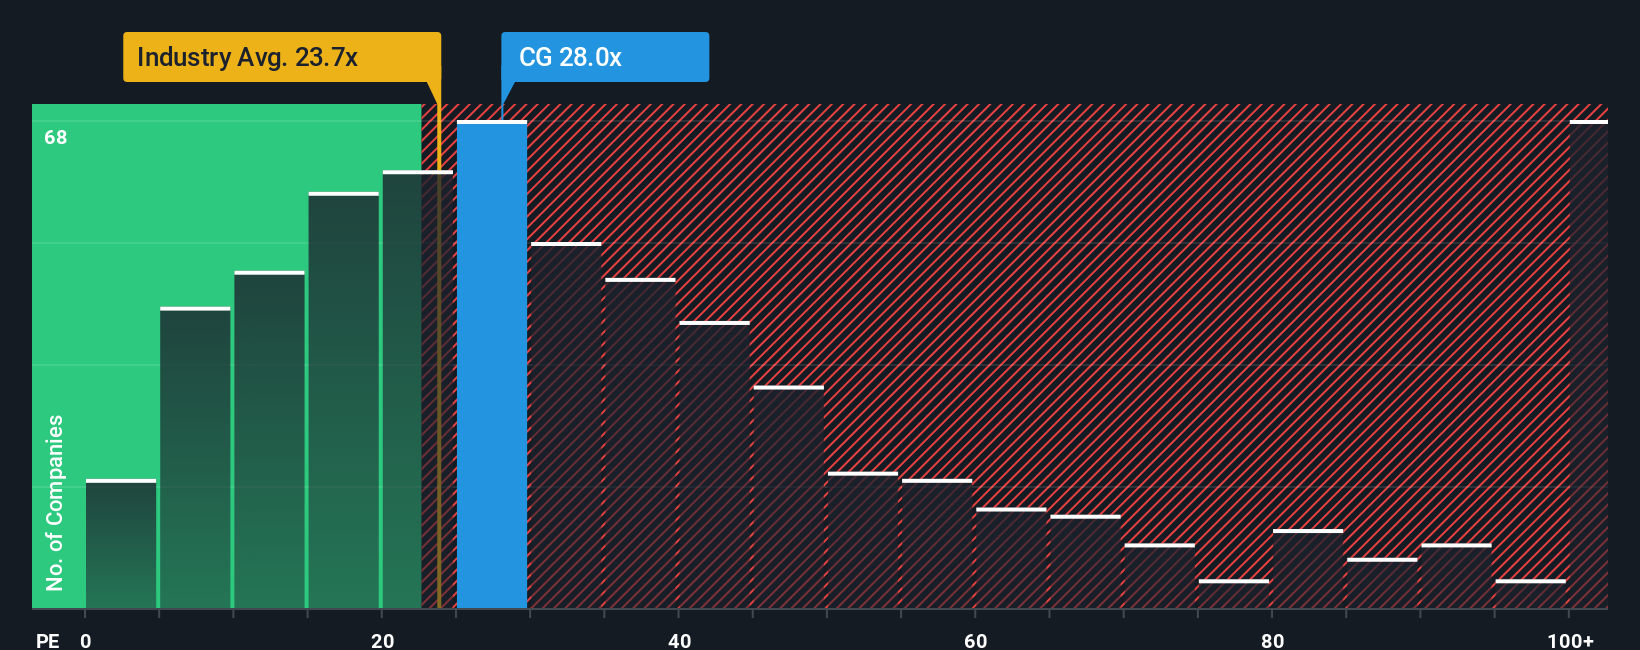
Carlyle Group currently trades at a PE ratio of 18.24x. When compared to the Capital Markets industry average of 26.98x and the peer group average of 20.93x, Carlyle’s multiple appears conservative. However, relying on simple averages can be misleading, since they do not account for a company’s unique characteristics or future prospects.
This is where Simply Wall St’s Fair Ratio becomes relevant. The Fair Ratio for Carlyle Group is calculated at 18.81x. Unlike standard benchmarking, this measure considers Carlyle’s growth outlook, risk factors, profit margins, its specific industry dynamics, and market cap, providing a more tailored assessment. By factoring in these complexities, the Fair Ratio offers a better sense of true value for long-term investors.
With Carlyle’s current PE ratio of 18.24x sitting very close to its Fair Ratio of 18.81x, the stock appears to be valued about right based on earnings.
Result: ABOUT RIGHT
PE ratios tell one story, but what if the real opportunity lies elsewhere? Discover companies where insiders are betting big on explosive growth.
Earlier we mentioned that there's an even better way to understand valuation, so let's introduce you to Narratives. A Narrative is a simple, powerful tool that lets you tell the story you believe about a company, explaining the reasons behind your unique fair value and the forecasts you think are most likely for things like revenues, earnings, and profit margins.
Narratives connect the dots: the business's story, your financial forecast, and what that means for fair value, all in one place and designed to make your thinking clear. You can easily create or browse Narratives right on the Simply Wall St Community page, where millions of investors share their perspectives and fair value estimates in real time.
By comparing a Narrative’s calculated fair value to the current share price, you'll get clear signals on when you think it makes sense to buy, hold, or sell. Narratives update automatically as fresh news, earnings, or other data comes in, which helps your investment thesis stay relevant and not just a static spreadsheet.
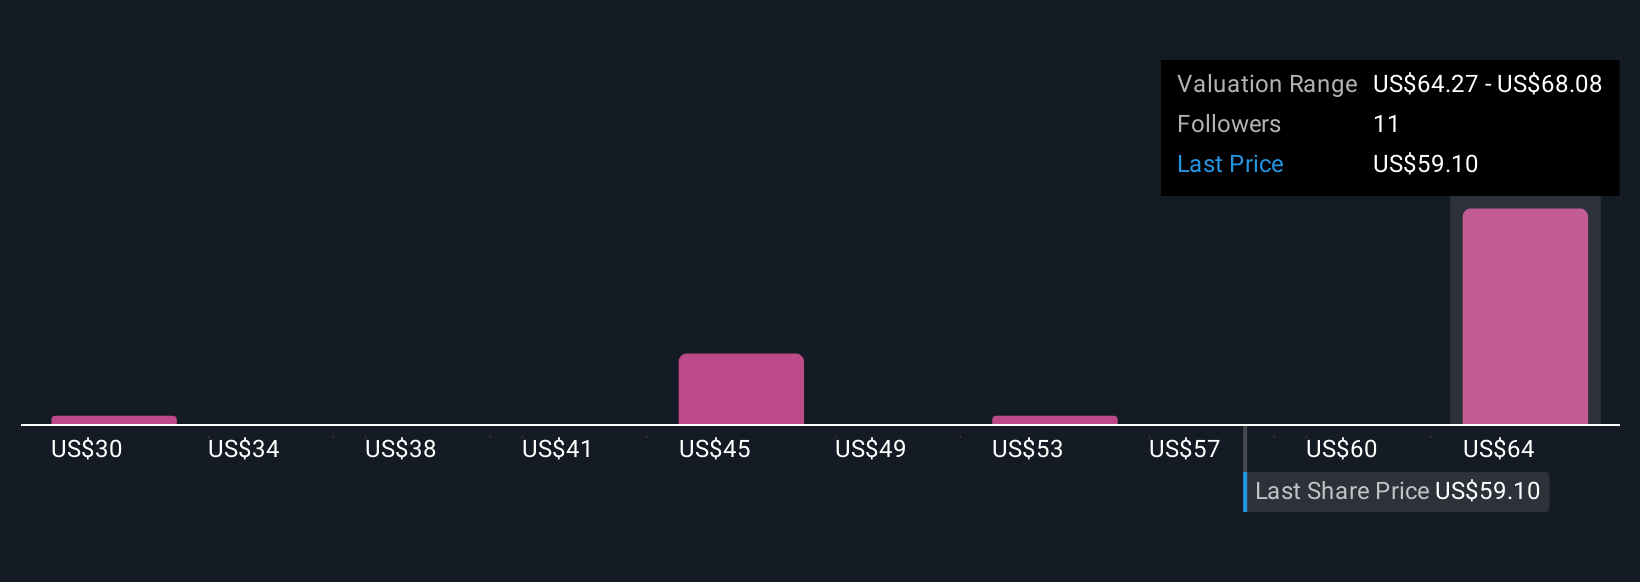
For example, the highest analyst Narrative estimates Carlyle Group’s fair value at $80.00 based on robust global expansion and margin growth, while the lowest puts it at $56.00 considering risks from competition and regulation. Your Narrative might land higher or lower, depending on your view of Carlyle’s future.
Do you think there's more to the story for Carlyle Group? Create your own Narrative to let the Community know!
This article by Simply Wall St is general in nature. We provide commentary based on historical data and analyst forecasts only using an unbiased methodology and our articles are not intended to be financial advice. It does not constitute a recommendation to buy or sell any stock, and does not take account of your objectives, or your financial situation. We aim to bring you long-term focused analysis driven by fundamental data. Note that our analysis may not factor in the latest price-sensitive company announcements or qualitative material. Simply Wall St has no position in any stocks mentioned.
