Capital City Bank Group (CCBG) Margin Strength Supports Bullish Narratives Despite Softer Quarterly EPS
Capital City Bank Group, Inc. CCBG | 44.68 44.68 | +1.06% 0.00% Pre |
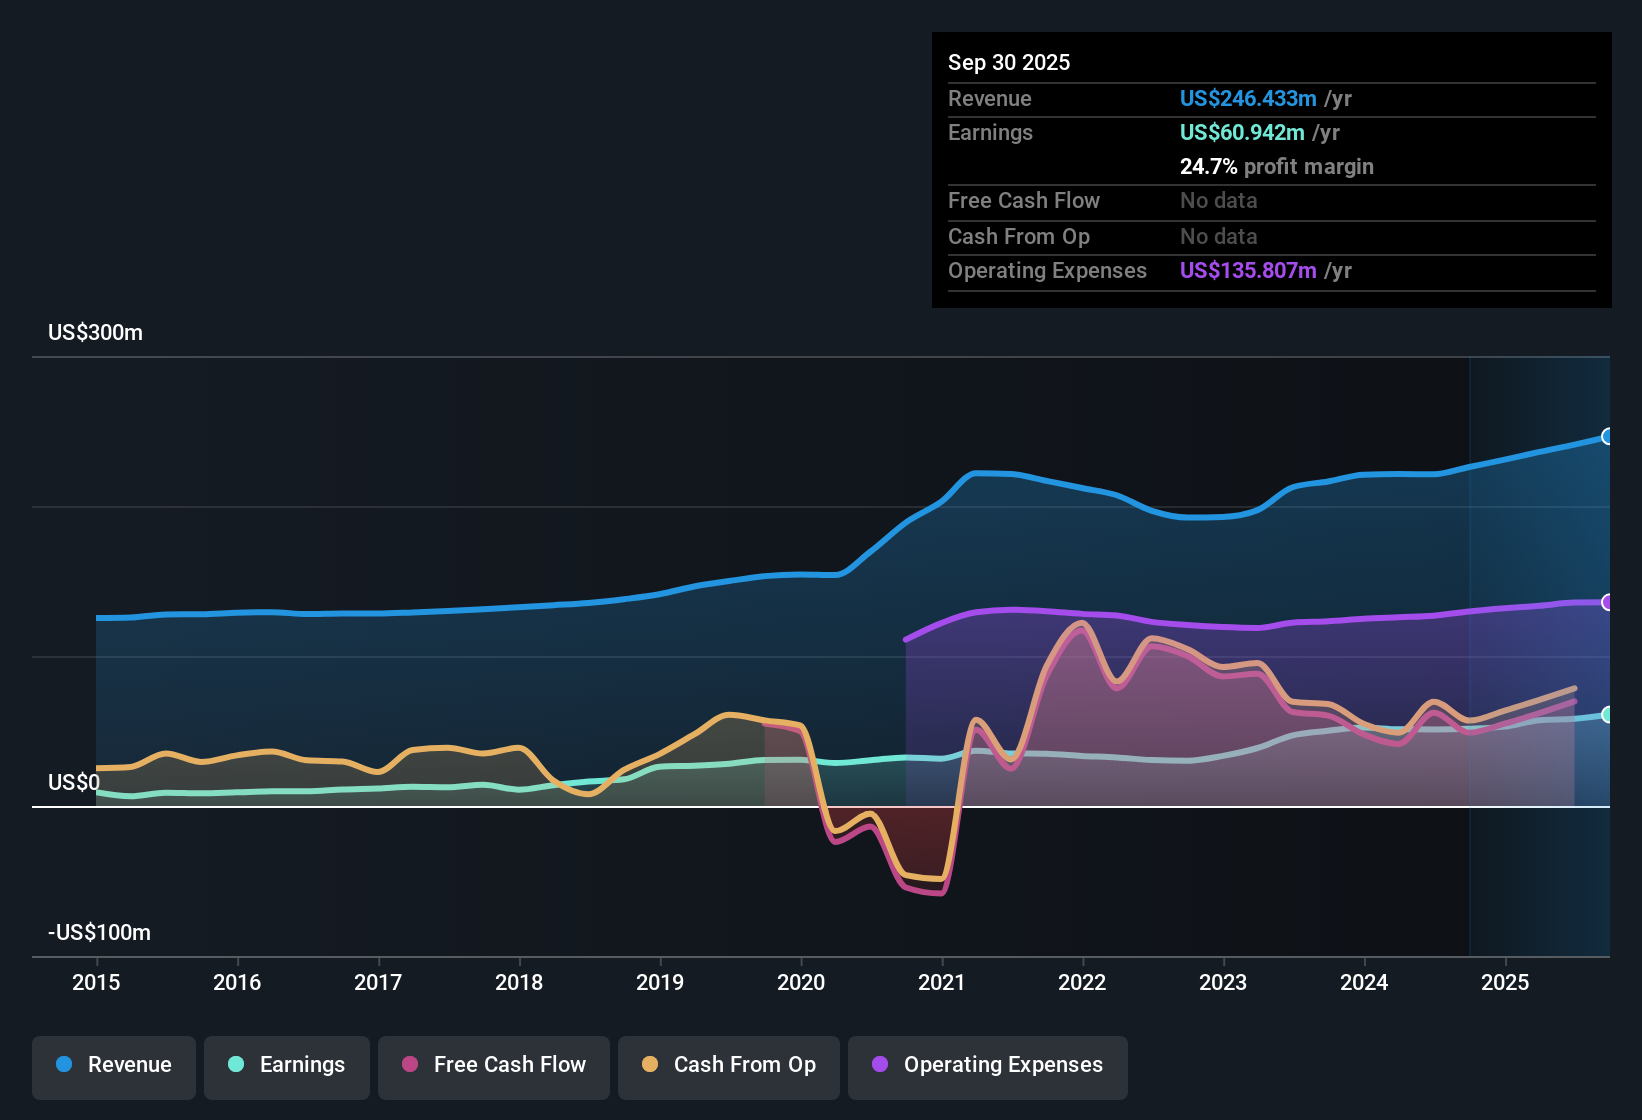
Capital City Bank Group (CCBG) closed FY 2025 with fourth quarter total revenue of US$61.5 million and basic EPS of US$0.80, alongside net income of US$13.7 million. On a trailing twelve month basis, EPS stood at US$3.61 on revenue of US$248.7 million and net income of US$61.6 million. Over the past year, the company has seen trailing twelve month revenue move from US$230.9 million to US$248.7 million and EPS rise from US$3.12 to US$3.61, giving you a clear sense of the earnings power behind the latest quarterly print. With a trailing net margin of 24.7% compared with 22.8% a year earlier, the story this season is very much about how profitability shapes the way investors read these results.
See our full analysis for Capital City Bank Group.With the headline numbers on the table, the next step is to see how this earnings profile lines up with the widely followed narratives around Capital City Bank Group and where the latest margin picture supports or challenges those views.
TTM profit growth and margins push higher
- On a trailing twelve month basis, net income is US$61.6 million on revenue of US$248.7 million, with net margin at 24.7% versus 22.8% a year earlier.
- Bullish investors often focus on earnings growing 15% per year over five years and 18.2% over the last year. That view is heavily supported by the trailing EPS move from US$3.12 to US$3.61 and the higher net margin. However, they still need to weigh that against the fact that quarterly EPS stepped down from US$0.99 in Q1 FY 2025 to US$0.80 in Q4 FY 2025, which shows the growth story is not a straight line.
Cost efficiency and credit quality move around
- Quarterly efficiency and asset quality have shifted through FY 2025, with the cost to income ratio ranging between 62.9% and 71.8% over the last six reported quarters and non performing loans moving between US$4.3 million and US$8.2 million in that same window.
- Bears often worry about how smaller regional banks handle costs and credit, and that concern finds some backing in the cost to income ratio, which was 71.8% in Q3 FY 2024 and 67.3% in Q2 FY 2025. Non performing loans also moved from US$6.3 million in Q4 FY 2024 to US$8.2 million by Q3 FY 2025. Yet those same figures also show the story is not one way, because cost to income came in lower at 62.9% in Q1 FY 2025 and non performing loans were US$4.3 million in that quarter, reminding you that the bank has operated with tighter costs and lower problem loans at points during the year.
P/E, dividend yield and DCF fair value gap
- The shares trade around US$42.36 with a trailing P/E of 11.9x, a trailing dividend yield of 2.46% and a DCF fair value in the dataset of US$73.12, which is materially higher than the current share price.
- What stands out for the bullish side is that they point to the shares trading roughly in line with the wider US Banks industry on P/E at 11.9x versus 11.8x, slightly below the peer average of 12.2x and well below the cited DCF fair value of US$73.12 while earnings have been growing at 15% a year over five years. Cautious investors counter that the small P/E discount to peers is modest and that any gap between US$42.36 and a modelled fair value relies on the same historical earnings and margin trends continuing without any evidence here about what happens next.
Next Steps
Don't just look at this quarter; the real story is in the long-term trend. We've done an in-depth analysis on Capital City Bank Group's growth and its valuation to see if today's price is a bargain. Add the company to your watchlist or portfolio now so you don't miss the next big move.
See What Else Is Out There
Capital City Bank Group’s story includes softer quarterly EPS in the latest quarter and periods of higher cost to income and rising non performing loans.
If you want ideas with a tighter grip on expenses and credit quality, check out solid balance sheet and fundamentals stocks screener (389 results) today and quickly zero in on financially sturdier candidates.
This article by Simply Wall St is general in nature. We provide commentary based on historical data and analyst forecasts only using an unbiased methodology and our articles are not intended to be financial advice. It does not constitute a recommendation to buy or sell any stock, and does not take account of your objectives, or your financial situation. We aim to bring you long-term focused analysis driven by fundamental data. Note that our analysis may not factor in the latest price-sensitive company announcements or qualitative material. Simply Wall St has no position in any stocks mentioned.