Carvana (CVNA) Valuation Check After Recent Share Price Volatility
Carvana Co. Class A CVNA | 320.22 332.12 | +1.06% +3.72% Post |
Carvana (CVNA) has been drawing attention after recent share price volatility, including a 23% decline over the past month. This has prompted investors to reassess how its current valuation lines up with its underlying business performance.
Over the past year, Carvana’s total shareholder return of 20.17% contrasts with recent share price pressure, including a 22.62% 30 day share price decline and a softer 6.11% 90 day share price return. This suggests momentum has been fading as investors reassess risk and valuation.
If Carvana’s swings have you rethinking concentration risk, it could be a good moment to broaden your watchlist and check out 23 top founder-led companies as a fresh set of ideas.
With Carvana showing a 19.76% intrinsic discount and trading about 40% below the average analyst price target, the key question is whether the recent pullback leaves upside on the table or if the market already reflects its future growth.
Most Popular Narrative: 28.8% Undervalued
Carvana's most followed narrative pegs fair value at about $481 per share, comfortably above the recent $342.87 close, which is what anchors the current valuation debate.
The company's scaled logistics and reconditioning infrastructure, bolstered by the integration of ADESA locations, is driving lower delivery and inbound transport costs; as utilization rises, these investments are expected to further improve operating leverage, helping gross margins and profitability. Expansion into ancillary products, such as auto financing and service contracts, leveraging proprietary customer and vehicle data, supports higher average revenue per user, stronger recurring revenue streams, and greater earnings stability.
Curious what kind of revenue growth and margin profile needs to come together for that fair value? The narrative leans on rising profitability, richer unit economics, and a premium earnings multiple that sits well above typical specialty retail names.
Result: Fair Value of $481 (UNDERVALUED)
However, there is still meaningful execution risk, including potential cost pressure if ADESA sites stay underutilized, as well as the chance that online competitors squeeze volumes and margins.
Another View: High P/E Puts More Weight On Execution
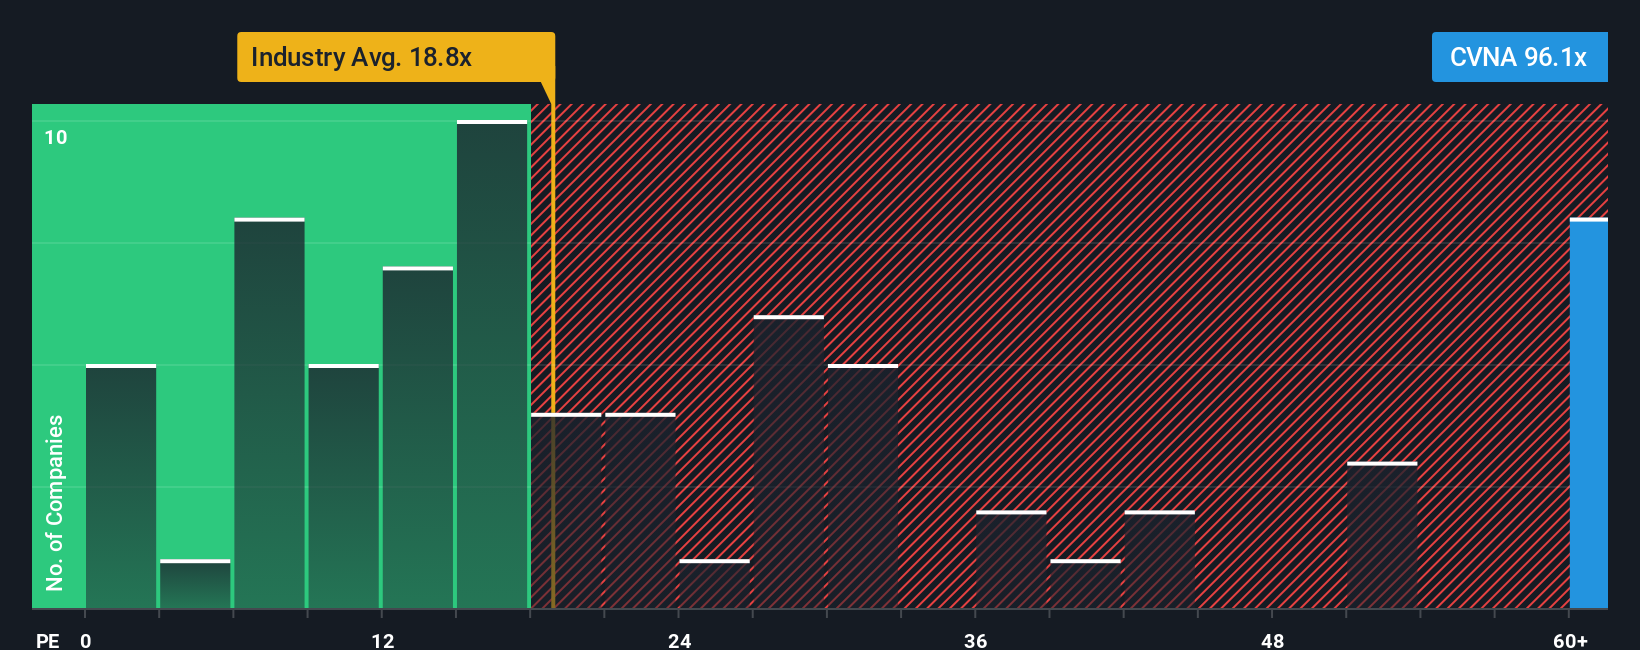
So far, the story leans on fair value around $481 and a 19.8% discount, but the current P/E of 77.1x paints a tougher picture. That is far above the US Specialty Retail average of 21.4x and a fair ratio of 36.6x. This suggests the market already prices in a lot of success. If growth or margins come in softer than expected, how much room is there for disappointment?
For a closer look at what this richer P/E implies, including how it compares with peers and that 36.6x fair ratio the market could move toward over time, See what the numbers say about this price — find out in our valuation breakdown. can help you pressure test your own assumptions.
Build Your Own Carvana Narrative
If you see the numbers differently or want to test your own assumptions against the market, you can build a custom thesis in just a few minutes by starting with Do it your way.
A great starting point for your Carvana research is our analysis highlighting 4 key rewards and 2 important warning signs that could impact your investment decision.
Looking for more investment ideas?
If Carvana has sparked new questions for you, do not stop here. Broaden your research now so you are not relying on a single story.
- Target quality at a discount by scanning our list of 53 high quality undervalued stocks that combine solid fundamentals with prices that may not fully reflect their potential.
- Lock in income potential by reviewing our hand picked 12 dividend fortresses that focus on companies offering higher yields with an eye on resilience.
- Dial down risk by checking our 84 resilient stocks with low risk scores where balance sheets and risk scores help you focus on durability before excitement.
This article by Simply Wall St is general in nature. We provide commentary based on historical data and analyst forecasts only using an unbiased methodology and our articles are not intended to be financial advice. It does not constitute a recommendation to buy or sell any stock, and does not take account of your objectives, or your financial situation. We aim to bring you long-term focused analysis driven by fundamental data. Note that our analysis may not factor in the latest price-sensitive company announcements or qualitative material. Simply Wall St has no position in any stocks mentioned.