
Please use a PC Browser to access Register-Tadawul
Get It
CBRE Group Stock: A Deep Dive Into Analyst Perspectives (7 Ratings)
CBRE Group Inc Class A CBRE | 159.58 | -0.55% |
Across the recent three months, 7 analysts have shared their insights on CBRE Group (NYSE:CBRE), expressing a variety of opinions spanning from bullish to bearish.
Summarizing their recent assessments, the table below illustrates the evolving sentiments in the past 30 days and compares them to the preceding months.
| Bullish | Somewhat Bullish | Indifferent | Somewhat Bearish | Bearish | |
|---|---|---|---|---|---|
| Total Ratings | 0 | 5 | 2 | 0 | 0 |
| Last 30D | 0 | 0 | 1 | 0 | 0 |
| 1M Ago | 0 | 1 | 0 | 0 | 0 |
| 2M Ago | 0 | 1 | 1 | 0 | 0 |
| 3M Ago | 0 | 3 | 0 | 0 | 0 |
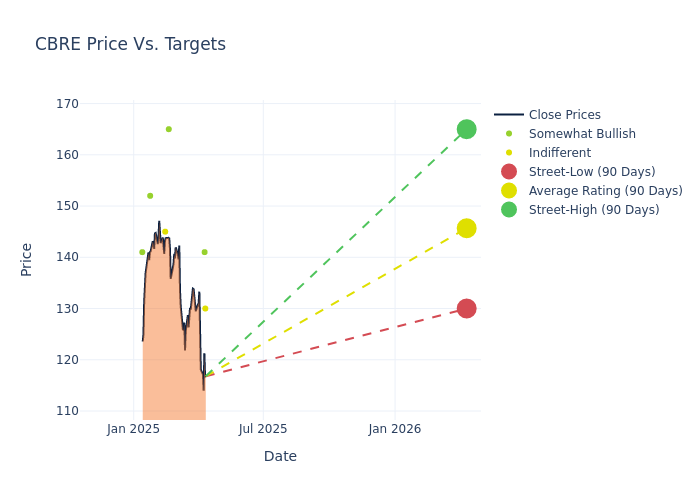
Providing deeper insights, analysts have established 12-month price targets, indicating an average target of $147.71, along with a high estimate of $165.00 and a low estimate of $130.00. This current average has increased by 0.58% from the previous average price target of $146.86.
The analysis of recent analyst actions sheds light on the perception of CBRE Group by financial experts. The following summary presents key analysts, their recent evaluations, and adjustments to ratings and price targets.
| Analyst | Analyst Firm | Action Taken | Rating |Current Price Target| Prior Price Target | |---------------------|-----------------------|---------------|---------------|--------------------|--------------------| |Alex Kramm |UBS |Lowers |Neutral | $130.00|$146.00 | |Anthony Paolone |JP Morgan |Lowers |Overweight | $141.00|$163.00 | |Ronald Kamdem |Morgan Stanley |Raises |Overweight | $165.00|$160.00 | |Jade Rahmani |Keefe, Bruyette & Woods|Raises |Market Perform | $145.00|$142.00 | |Patrick O'Shaughnessy|Raymond James |Lowers |Outperform | $152.00|$155.00 | |Ronald Kamdem |Morgan Stanley |Raises |Overweight | $160.00|$115.00 | |Steve Sakwa |Evercore ISI Group |Lowers |Outperform | $141.00|$147.00 |
To gain a panoramic view of CBRE Group's market performance, explore these analyst evaluations alongside essential financial indicators. Stay informed and make judicious decisions using our Ratings Table.
Stay up to date on CBRE Group analyst ratings.
CBRE Group provides a wide range of real estate services to owners, occupants, and investors worldwide, including leasing, property and project management, and capital markets advisory. CBRE's investment management arm manages over $140 billion for clients across diverse public and private real estate strategies.
Market Capitalization Analysis: With a profound presence, the company's market capitalization is above industry averages. This reflects substantial size and strong market recognition.
Revenue Growth: CBRE Group's remarkable performance in 3M is evident. As of 31 December, 2024, the company achieved an impressive revenue growth rate of 16.25%. This signifies a substantial increase in the company's top-line earnings. As compared to competitors, the company encountered difficulties, with a growth rate lower than the average among peers in the Real Estate sector.
Net Margin: CBRE Group's net margin is impressive, surpassing industry averages. With a net margin of 4.68%, the company demonstrates strong profitability and effective cost management.
Return on Equity (ROE): The company's ROE is a standout performer, exceeding industry averages. With an impressive ROE of 5.69%, the company showcases effective utilization of equity capital.
Return on Assets (ROA): The company's ROA is a standout performer, exceeding industry averages. With an impressive ROA of 1.98%, the company showcases effective utilization of assets.
Debt Management: CBRE Group's debt-to-equity ratio is below the industry average at 0.68, reflecting a lower dependency on debt financing and a more conservative financial approach.
Within the domain of banking and financial systems, analysts specialize in reporting for specific stocks or defined sectors. Their work involves attending company conference calls and meetings, researching company financial statements, and communicating with insiders to publish "analyst ratings" for stocks. Analysts typically assess and rate each stock once per quarter.
Some analysts publish their predictions for metrics such as growth estimates, earnings, and revenue to provide additional guidance with their ratings. When using analyst ratings, it is important to keep in mind that stock and sector analysts are also human and are only offering their opinions to investors.
If you want to keep track of which analysts are outperforming others, you can view updated analyst ratings along withanalyst success scores in Benzinga Pro.
Which Stocks Are Analysts Recommending Now?
Benzinga Edge gives you instant access to all major analyst upgrades, downgrades, and price targets. Sort by accuracy, upside potential, and more. Click here to stay ahead of the market.
This article was generated by Benzinga's automated content engine and reviewed by an editor.
