Chemung Financial (CHMG) has just wrapped up FY 2025 with fourth quarter total revenue of US$29.4 million and basic EPS of US$1.61, alongside net income excluding extra items of US$7.7 million. Over the past few quarters, the company has seen total revenue range from US$24.6 million to US$29.4 million while basic EPS moved between US$1.24 in Q4 2024 and US$1.61 in Q4 2025, with a sharp loss in Q2 2025 breaking that pattern. Taken together with the latest print, the focus is on how sustainably Chemung Financial can manage its margins from here.
See our full analysis for Chemung Financial.
With the headline numbers on the table, the next step is to set these results against the widely followed narratives about Chemung Financial to see which views the data supports and which ones are challenged by the reported figures.
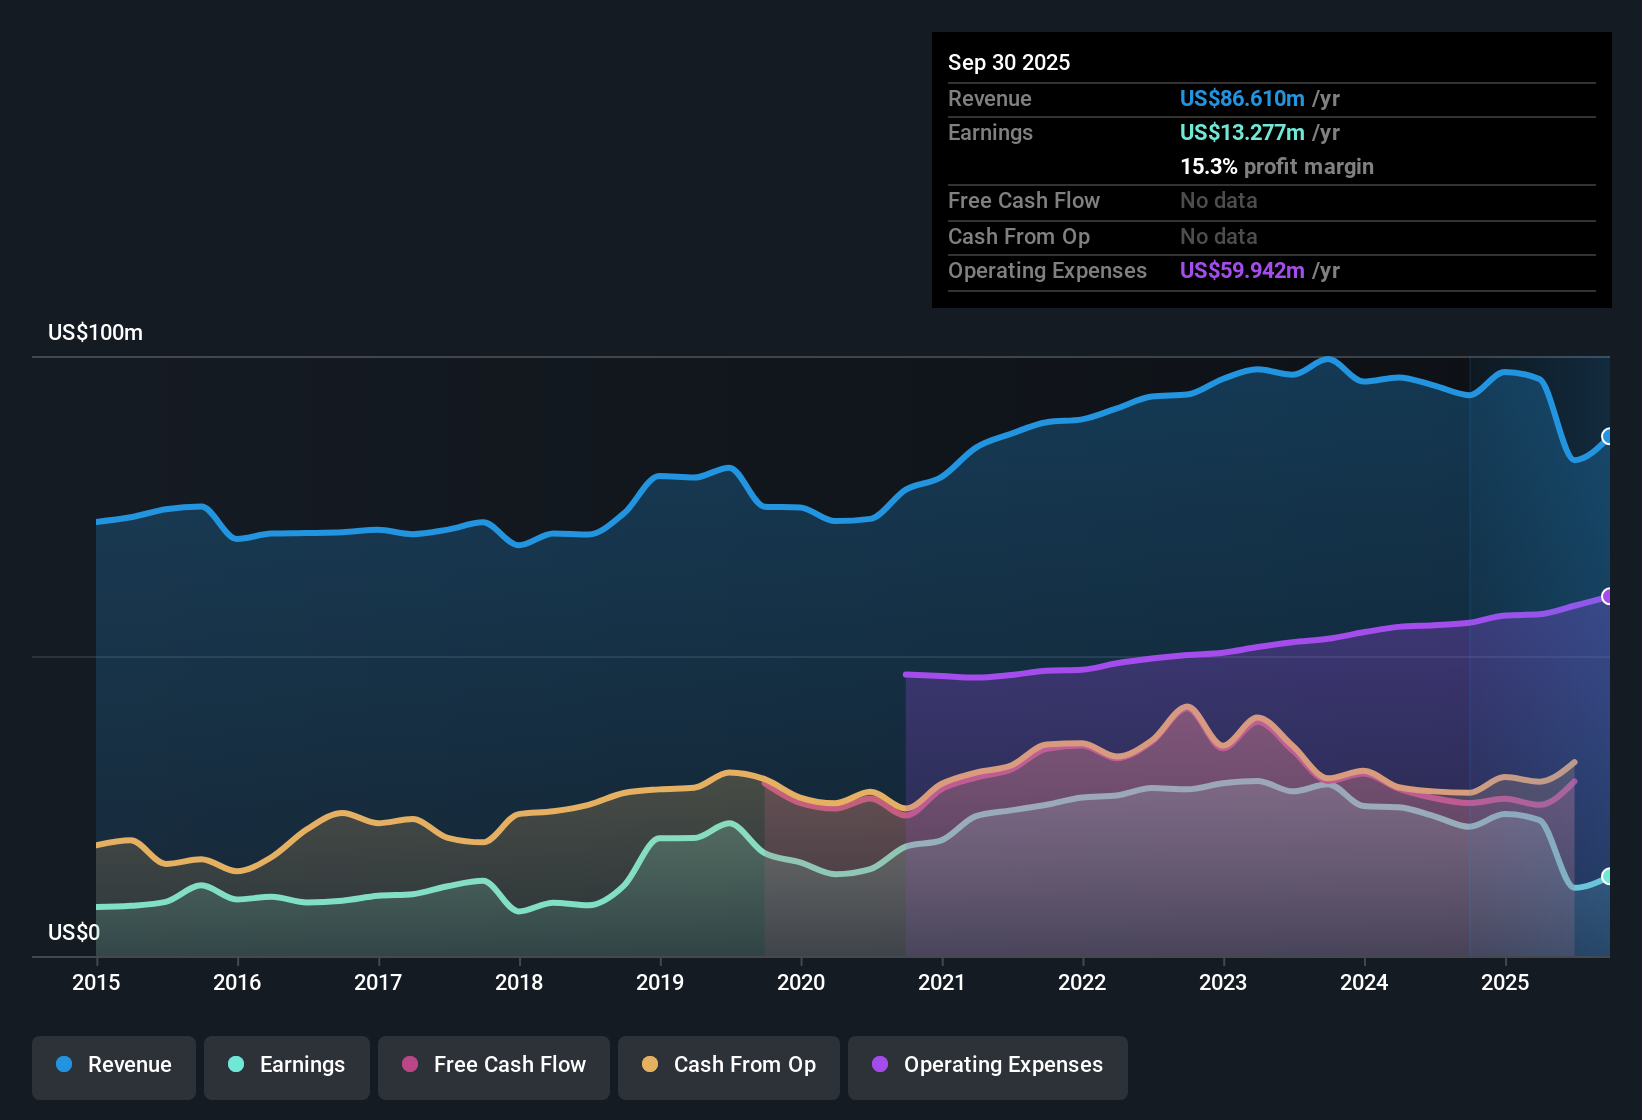
NasdaqGS:CHMG Earnings & Revenue History as at Jan 2026
Margins and Costs Move Together
Across 2025, Chemung Financial's reported net interest margin ranged from 2.96% in Q1 to 3.45% in Q3, while the cost to income ratio moved between 61.18% and 65.69% over the same quarters.
What stands out for a bullish view is that margin and cost metrics in 2025, such as the 3.45% net interest margin and 61.18% cost to income ratio in Q3, line up with the idea of a traditional community bank that relies on spread income and disciplined expense control. However, the trailing net profit margin of 16.7% versus 24.3% a year earlier shows that recent profitability is not as strong as that optimistic framing suggests.
Bulls who like the long history and traditional model still have to reconcile that lower 16.7% trailing margin with earlier levels near 24.3% cited in the data.
At the same time, basic EPS in the individual 2025 quarters ranged from a loss of US$1.34 in Q2 to profits of US$1.26 to US$1.62 in the other quarters, which shows that the bank's earnings pattern has been uneven even within a single year.
Loan Book Growth with Mixed Credit Signals
Total loans in the periodical data stepped from US$2,028.95 million in Q3 2024 to US$2,202.36 million in Q3 2025, while non performing loans moved in a band between US$7.76 million and US$10.55 million across the reported quarters.
Critics who take a more bearish stance may focus on the fact that non performing loans sat at US$10.55 million in Q3 2024 and US$9.88 million in Q1 2025, even as total loans increased. This means the growing loan book and the exposure figures given in the data leave room for bears to argue that asset quality needs to be watched closely.
The combination of higher total loans of over US$2.2b and non performing loans still around US$7.76 million to US$9.88 million in several quarters keeps credit costs in the conversation for cautious investors.
Because net interest margin in those same quarters was between 2.72% and 3.45%, any shift in non performing loans within that US$7.76 million to US$10.55 million range could have a direct impact on future profitability metrics that bears are likely to track closely.
Valuation Gap Between P/E and DCF Fair Value
The stock trades on a trailing P/E of 18.8x with a share price of US$59.11, while the supplied DCF fair value is US$133.07 and the cited analyst price target is US$64.25, and the modelled comparison suggests the market price is about 55.6% below that DCF fair value.
What is relevant for a bullish angle is that forecasts in the dataset point to earnings growth of about 38.6% per year and revenue growth of about 19% per year, alongside a 2.3% dividend yield. However, the trailing P/E of 18.8x is higher than both the 12.4x peer average and the 11.8x US Banks industry, so the case for upside rests on those growth forecasts and the DCF fair value of US$133.07 being more important than the premium multiple on past earnings.
Supporters of the stock can point to trailing 12 month net income of US$15.10 million on revenue of US$90.67 million and the 16.7% profit margin as the earnings base that the 38.6% forecast growth rate is applied to.
Skeptics, on the other hand, can counter that the same P/E of 18.8x, which is above both peer and industry averages, already prices in some of that forecast growth even before any change in the DCF fair value or the US$64.25 price target is reflected in the share price of US$59.11.
To see how this valuation debate ties back
Next Steps
Don't just look at this quarter; the real story is in the long-term trend. We've done an in-depth analysis on Chemung Financial's growth and its valuation to see if today's price is a bargain. Add the company to your watchlist or portfolio now so you don't miss the next big move.
See What Else Is Out There
Chemung Financial's higher 18.8x P/E versus peer and industry averages, alongside uneven quarterly earnings, leaves questions around how much strength is already priced in.
If that mix of premium pricing and choppy results feels uncomfortable, check out these 881 undervalued stocks based on cash flows now to focus on companies where the market price still looks more modest against their fundamentals.
This article by Simply Wall St is general in nature. We provide commentary based on historical data and analyst forecasts only using an unbiased methodology and our articles are not intended to be financial advice. It does not constitute a recommendation to buy or sell any stock, and does not take account of your objectives, or your financial situation. We aim to bring you long-term focused analysis driven by fundamental data. Note that our analysis may not factor in the latest price-sensitive company announcements or qualitative material. Simply Wall St has no position in any stocks mentioned.