
Please use a PC Browser to access Register-Tadawul
Get It
Cheniere Energy Partners (CQP): Assessing Valuation After BMO's Bullish Analyst Coverage and Sector Growth Signals
Cheniere Energy Partners, L.P. CQP | 52.94 52.94 | -1.87% 0.00% Pre |
Based on the price-to-earnings (P/E) ratio, Cheniere Energy Partners stock trades at a 12.7x multiple, which is below both the U.S. market average (19.2x) and the U.S. oil and gas industry average (13.2x). This suggests the shares are currently valued more attractively than many peers in the sector.
The P/E ratio measures how much investors are willing to pay for each dollar of a company’s earnings. It is a widely used tool for comparing valuation across companies and sectors, especially for those with stable profits like Cheniere Energy Partners.
Given that CQP is delivering positive profits and its P/E is below industry and peer averages, the market may be underestimating the company’s growth prospects and earnings potential. This valuation could signal an opportunity for investors seeking value in the energy sector.
Result: Fair Value of $52.39 (ABOUT RIGHT)
See our latest analysis for Cheniere Energy Partners.However, slowing revenue growth and recent underperformance compared to industry peers could challenge CQP’s positive outlook if investor sentiment shifts.
Find out about the key risks to this Cheniere Energy Partners narrative.Taking a step back from traditional valuation ratios, our SWS DCF model suggests that Cheniere Energy Partners may actually be trading above its estimated fair value. Does this raise doubts about the apparent bargain, or is the market factoring in something extra?
Look into how the SWS DCF model arrives at its fair value.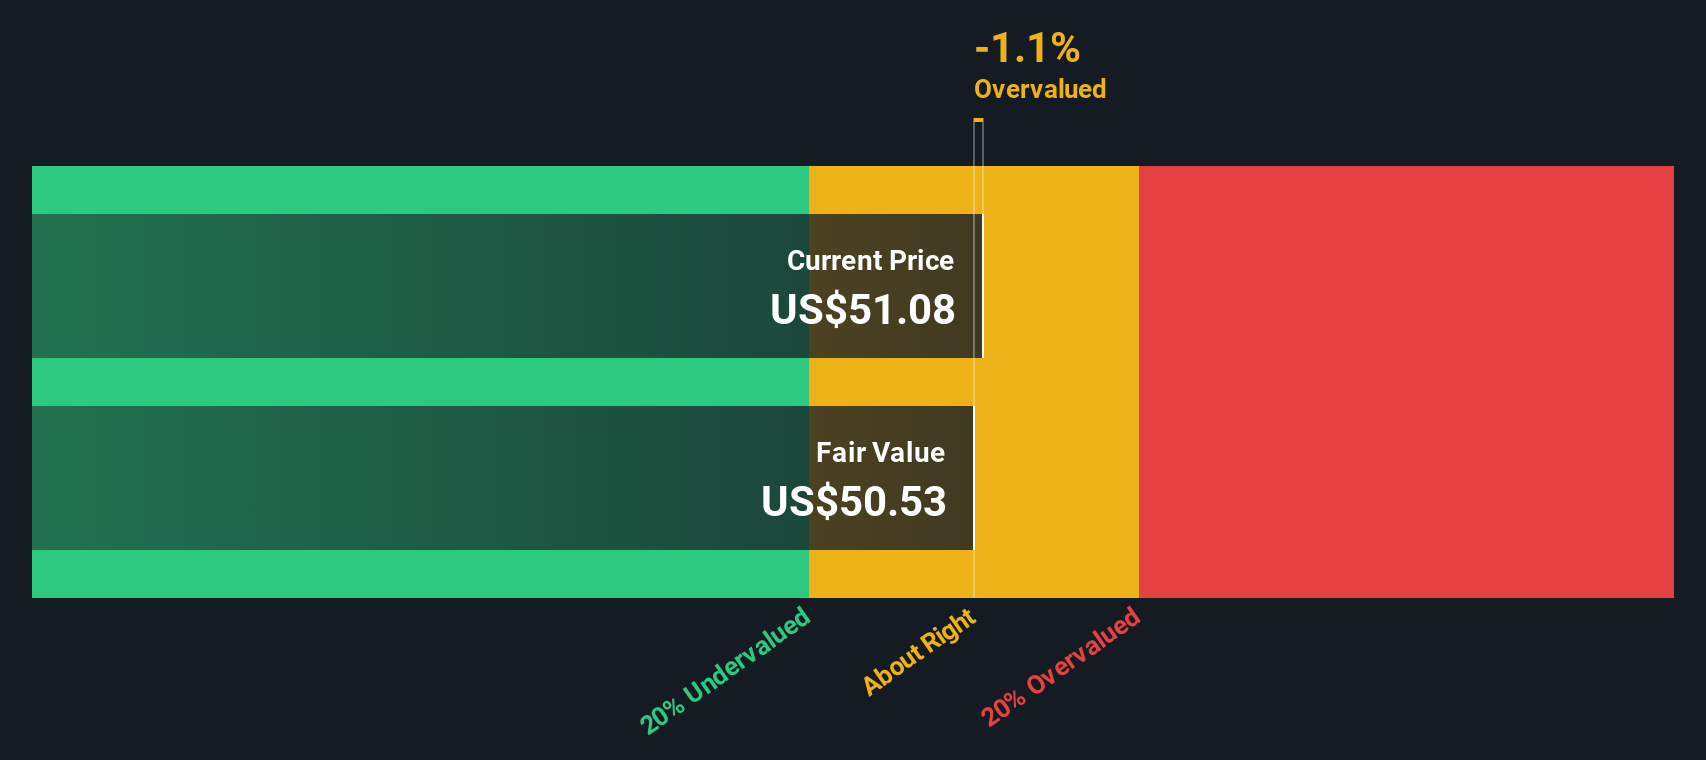
If you see things differently or want a hands-on approach to the data, you can craft your own take in just a few minutes. Do it your way.
A great starting point for your Cheniere Energy Partners research is our analysis highlighting 3 key rewards and 3 important warning signs that could impact your investment decision.
Step up your portfolio game by seeking out new opportunities. The Simply Wall Street Screener brings you data-driven picks so you never fall behind the crowd.
This article by Simply Wall St is general in nature. We provide commentary based on historical data and analyst forecasts only using an unbiased methodology and our articles are not intended to be financial advice. It does not constitute a recommendation to buy or sell any stock, and does not take account of your objectives, or your financial situation. We aim to bring you long-term focused analysis driven by fundamental data. Note that our analysis may not factor in the latest price-sensitive company announcements or qualitative material. Simply Wall St has no position in any stocks mentioned.
