CME Group (CME): Valuation Spotlight as Record Precious Metals Trading Signals Surge in Market Activity
CME Group Inc. Class A CME | 295.35 296.01 | -0.75% +0.22% Pre |
CME Group (CME) has caught investor attention after announcing record-breaking volumes across its metals complex, particularly in precious metals futures and options. The recent launch of its 1-Ounce Gold futures contract has generated considerable trading activity and stands out as a notable achievement.
CME Group’s bustling year has seen not just new records in precious metals trading, but also major steps like expanding cryptocurrency market access and finalizing the high-profile sale of OSTTRA. Against this backdrop, CME’s share price has climbed 17% year-to-date, supported by robust total shareholder returns over the longer term: 27.9% in the past year and nearly doubling over five years. This shows steady momentum as investor enthusiasm builds on both operational performance and capital returns.
If the uptick in trading volumes and business transformation has you scanning the market, this is the perfect moment to see what else stands out in the landscape and discover fast growing stocks with high insider ownership
But with CME shares already up strongly and analysts sending mixed signals, the key question is whether the current price fairly reflects future growth or if there is still room for investors to capitalize on further gains.
Most Popular Narrative: 3.8% Undervalued
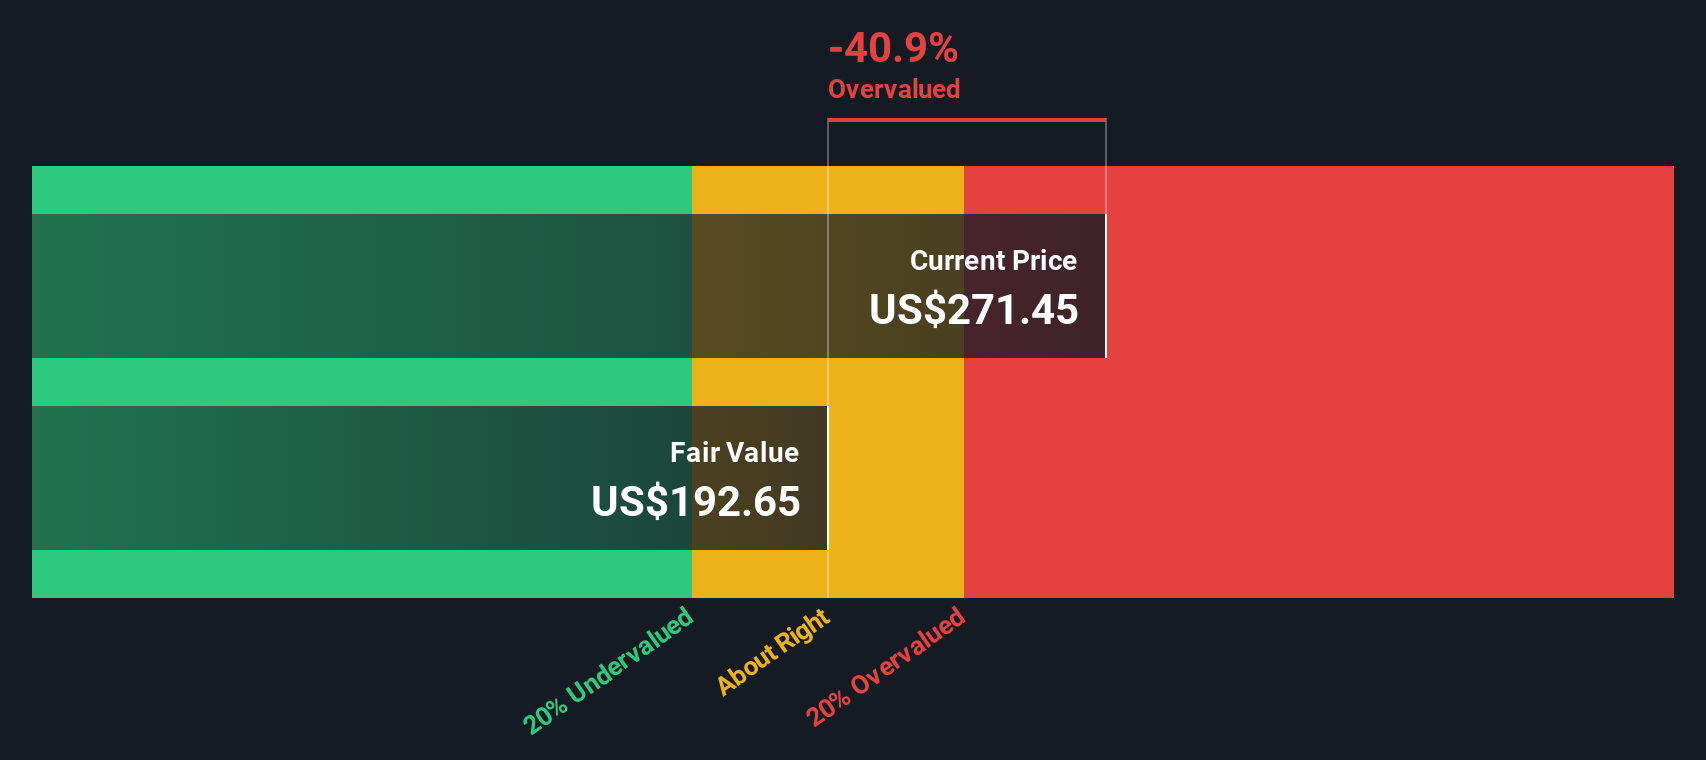
With CME Group closing at $271.45, the most followed narrative projects a fair value slightly higher, setting the stage for a close valuation debate. The narrative draws its conclusions using a discount rate of 8.13% and weighs major growth drivers against sector dynamics.
Heightened global macroeconomic uncertainty, record sovereign debt issuance, persistent geopolitical tensions, and ongoing trade disputes are fueling sustained demand for risk management and hedging solutions. This is evidenced by record contract volumes and open interest. This trend is likely to support continued revenue and fee growth.
Want to know which bold analyst assumptions create room for that higher price tag? The projected growth hinges on trends, margins, and a controversial future earnings multiple baked into the model. Discover what powers this narrative’s valuation and challenge your own expectations. Dig into the full story now.
Result: Fair Value of $282.11 (UNDERVALUED)
However, a sustained drop in volatility or rising competition from alternative trading platforms could quickly reduce demand and put pressure on CME’s revenues and margins.
Another View: DCF Model Sheds Caution
While analyst targets suggest CME Group is trading slightly below fair value, the SWS DCF model tells a different story. Based on long-term cash flow projections, the DCF model implies CME shares are actually overvalued, with a fair value of just $192.65 compared to today’s price. Can cash flows really justify today’s optimism, or is the market pricing in more risk than it appears?
Simply Wall St performs a discounted cash flow (DCF) on every stock in the world every day (check out CME Group for example). We show the entire calculation in full. You can track the result in your watchlist or portfolio and be alerted when this changes, or use our stock screener to discover undervalued stocks based on their cash flows. If you save a screener we even alert you when new companies match - so you never miss a potential opportunity.
Build Your Own CME Group Narrative
Curious if your perspective differs or want to dig deeper? You can easily build your own CME Group narrative from the ground up in just a few minutes. Do it your way
A great starting point for your CME Group research is our analysis highlighting 2 key rewards and 2 important warning signs that could impact your investment decision.
Seeking Your Next Big Idea?
Why settle for one opportunity when you could uncover several? Take control and tap into smart investing angles chosen by our expert screeners before others catch on.
- Capitalize on strong yields and steady cash flow by checking out these 19 dividend stocks with yields > 3%, which consistently deliver dividends above 3%.
- Get ahead of the curve with these 24 AI penny stocks, pushing artificial intelligence boundaries and powering tomorrow’s market leaders.
- Strengthen your portfolio with these 899 undervalued stocks based on cash flows, identified as trading below intrinsic value based on reliable cash flow projections.
This article by Simply Wall St is general in nature. We provide commentary based on historical data and analyst forecasts only using an unbiased methodology and our articles are not intended to be financial advice. It does not constitute a recommendation to buy or sell any stock, and does not take account of your objectives, or your financial situation. We aim to bring you long-term focused analysis driven by fundamental data. Note that our analysis may not factor in the latest price-sensitive company announcements or qualitative material. Simply Wall St has no position in any stocks mentioned.