CNA Financial (CNA) Earnings Story Centers On Stronger P&C Combined Ratios Challenging Cautionary Narratives
CNA Financial Corporation CNA | 46.60 | +0.50% |
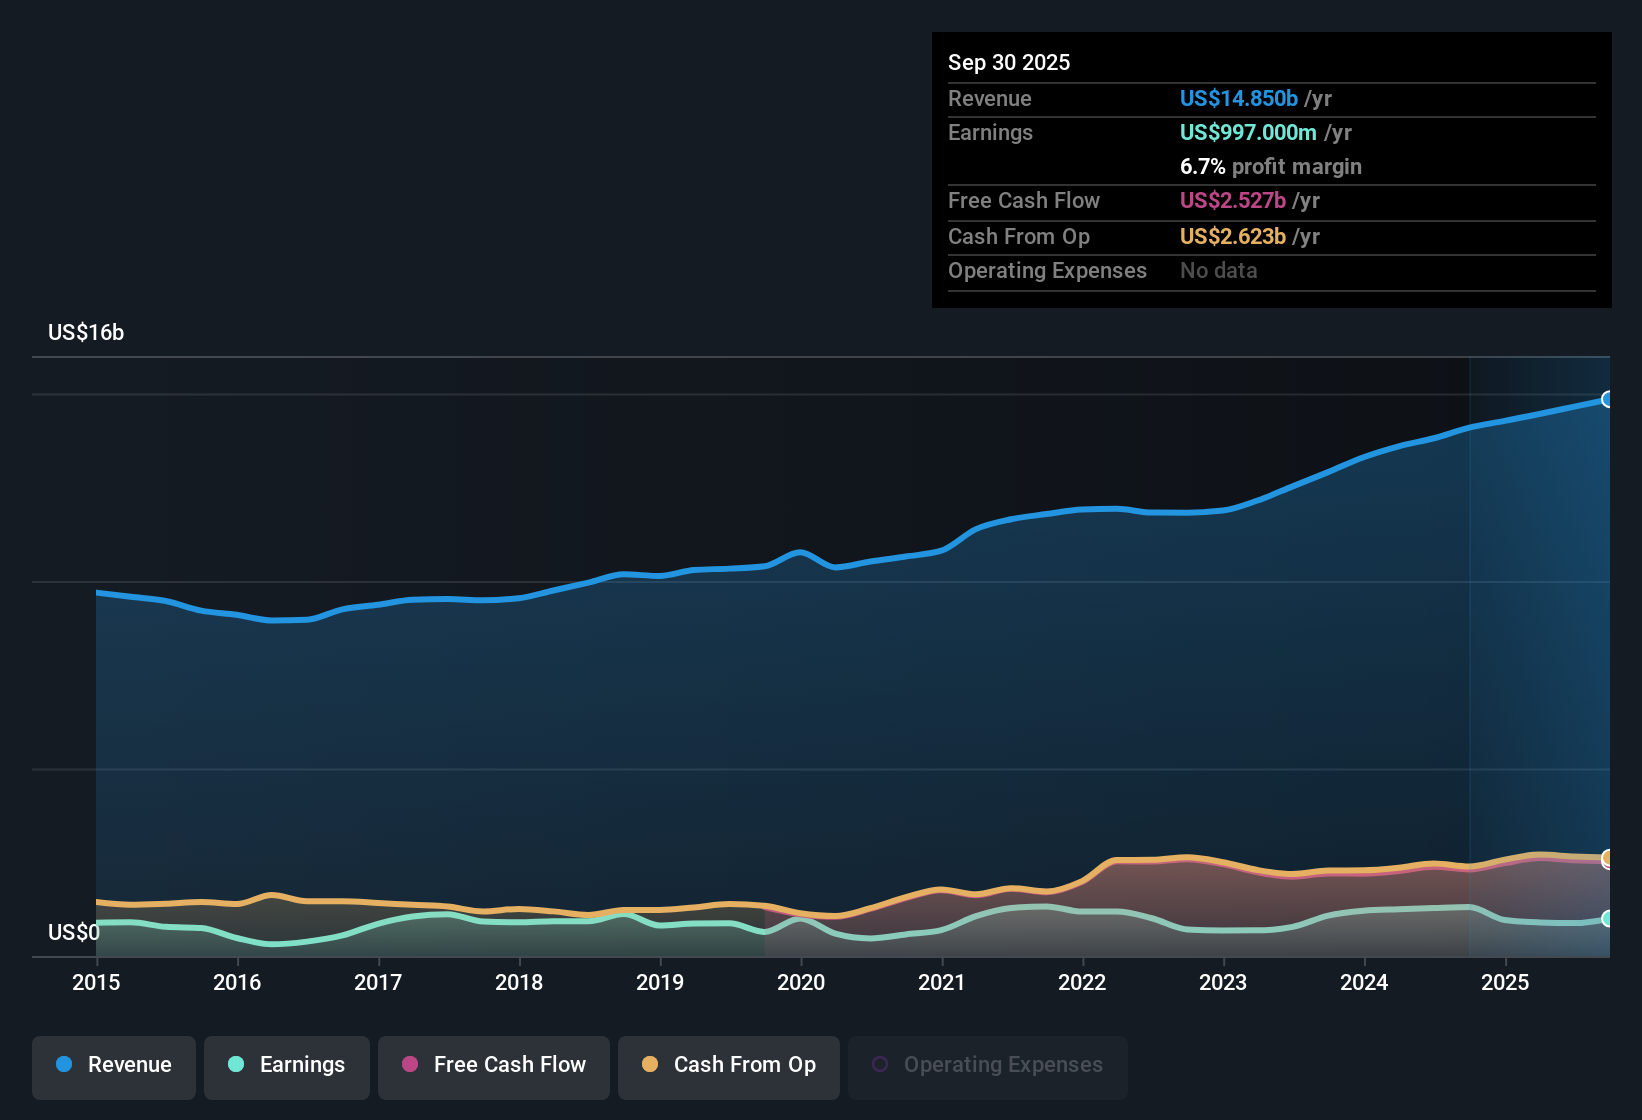
CNA Financial (CNA) has wrapped up FY 2025 with fourth quarter total revenue of US$3.8 billion, basic EPS of US$1.11 and net income of US$302 million. Its trailing twelve month figures show revenue of US$15.0 billion, EPS of US$4.71 and net income of US$1.28 billion. Over the past year, the company has seen revenue move from US$14.3 billion to US$15.0 billion and trailing EPS shift from US$3.53 to US$4.71. This sets the backdrop for how you might read this latest print. With net profit margin reported at 8.5% over the last twelve months, the focus now is on how durable that profitability profile looks against the headline results.
See our full analysis for CNA Financial.With the numbers on the table, the next step is to see how this earnings story lines up against the prevailing narratives around CNA. This can highlight where sentiment on growth and risk fits the recent performance and where it might be out of sync.
8.5% Net Margin Pairs With Stronger Underwriting
- CNA booked US$1.28b in net income over the last 12 months on US$15.0b of revenue, which works out to an 8.5% net margin compared with 6.7% a year earlier in the risk summary.
- Analysts' consensus view links this margin profile to stronger underwriting, and the combined ratios in 2025 back that up in places, but not perfectly:
- The P&C combined ratio moved from 101.1% in Q1 2025 to 94.8% in Q2 and 92.7% in Q3, which supports the idea of more efficient underwriting and expense control.
- At the same time, the 96.7% combined ratio in the prior trailing period shows underwriting was already reasonably tight, so the 8.5% margin and 33.3% earnings growth need to be weighed against a longer history of more modest 1.2% annual earnings growth.
33.3% Earnings Growth Vs 1.2% Long Run
- Over the last 12 months, earnings grew 33.3% year on year, compared with a 1.2% average annual earnings growth rate over five years, so this latest period looks much stronger than the longer trend.
- Consensus narrative expects that underwriting gains and higher investment income can keep supporting earnings, and the recent quarterly pattern gives both support and some checks:
- Within FY 2025, net income moved from US$274 million in Q1 to US$403 million in Q3 before settling at US$302 million in Q4, which fits with the idea of solid profitability but also shows that earnings can move around from quarter to quarter.
- Commentary also flags elevated catastrophe losses and less favorable loss ratios in some lines, which sits alongside the strong 12 month earnings number and reminds you that a single strong period does not erase the more modest 1.2% five year growth record.
P/E Of 10.3x And Price Below DCF Value
- CNA trades on a 10.3x P/E at a share price of US$48.80, below peers at 15.6x and the US Insurance industry at 12.6x, and also below a DCF fair value of US$68.25 in the analysis data.
- Bears argue that income focused investors still have reasons to be cautious, and the data gives them some support alongside the cheaper valuation:
- The dividend track record is described as unstable, which can matter for investors who are comparing CNA to other insurers that target more consistent payouts.
- Even with the stock sitting below the US$68.25 DCF fair value and below peer P/E levels, the combination of an unstable dividend history and references to underwriting volatility in areas like commercial auto could help explain why the market is not assigning peer like multiples.
Next Steps
To see how these results tie into long-term growth, risks, and valuation, check out the full range of community narratives for CNA Financial on Simply Wall St. Add the company to your watchlist or portfolio so you'll be alerted when the story evolves.
See the numbers another way? Take a couple of minutes to test your view against the data and shape your own CNA story: Do it your way.
A great starting point for your CNA Financial research is our analysis highlighting 2 key rewards and 1 important warning sign that could impact your investment decision.
See What Else Is Out There
CNA’s earnings picture relies on underwriting that can swing with catastrophe losses and an unstable dividend record, which may not suit investors seeking consistency.
If those payout gaps and profit swings concern you, put them in context by checking companies in our 14 dividend fortresses that aim for stronger, steadier income profiles.
This article by Simply Wall St is general in nature. We provide commentary based on historical data and analyst forecasts only using an unbiased methodology and our articles are not intended to be financial advice. It does not constitute a recommendation to buy or sell any stock, and does not take account of your objectives, or your financial situation. We aim to bring you long-term focused analysis driven by fundamental data. Note that our analysis may not factor in the latest price-sensitive company announcements or qualitative material. Simply Wall St has no position in any stocks mentioned.