CSW Industrials (CSWI) Margin Improvement Tests Bullish Earnings Narratives

CSW Industrials, Inc. +0.22%

CSW Industrials, Inc.

CSW

311.40

+0.22%

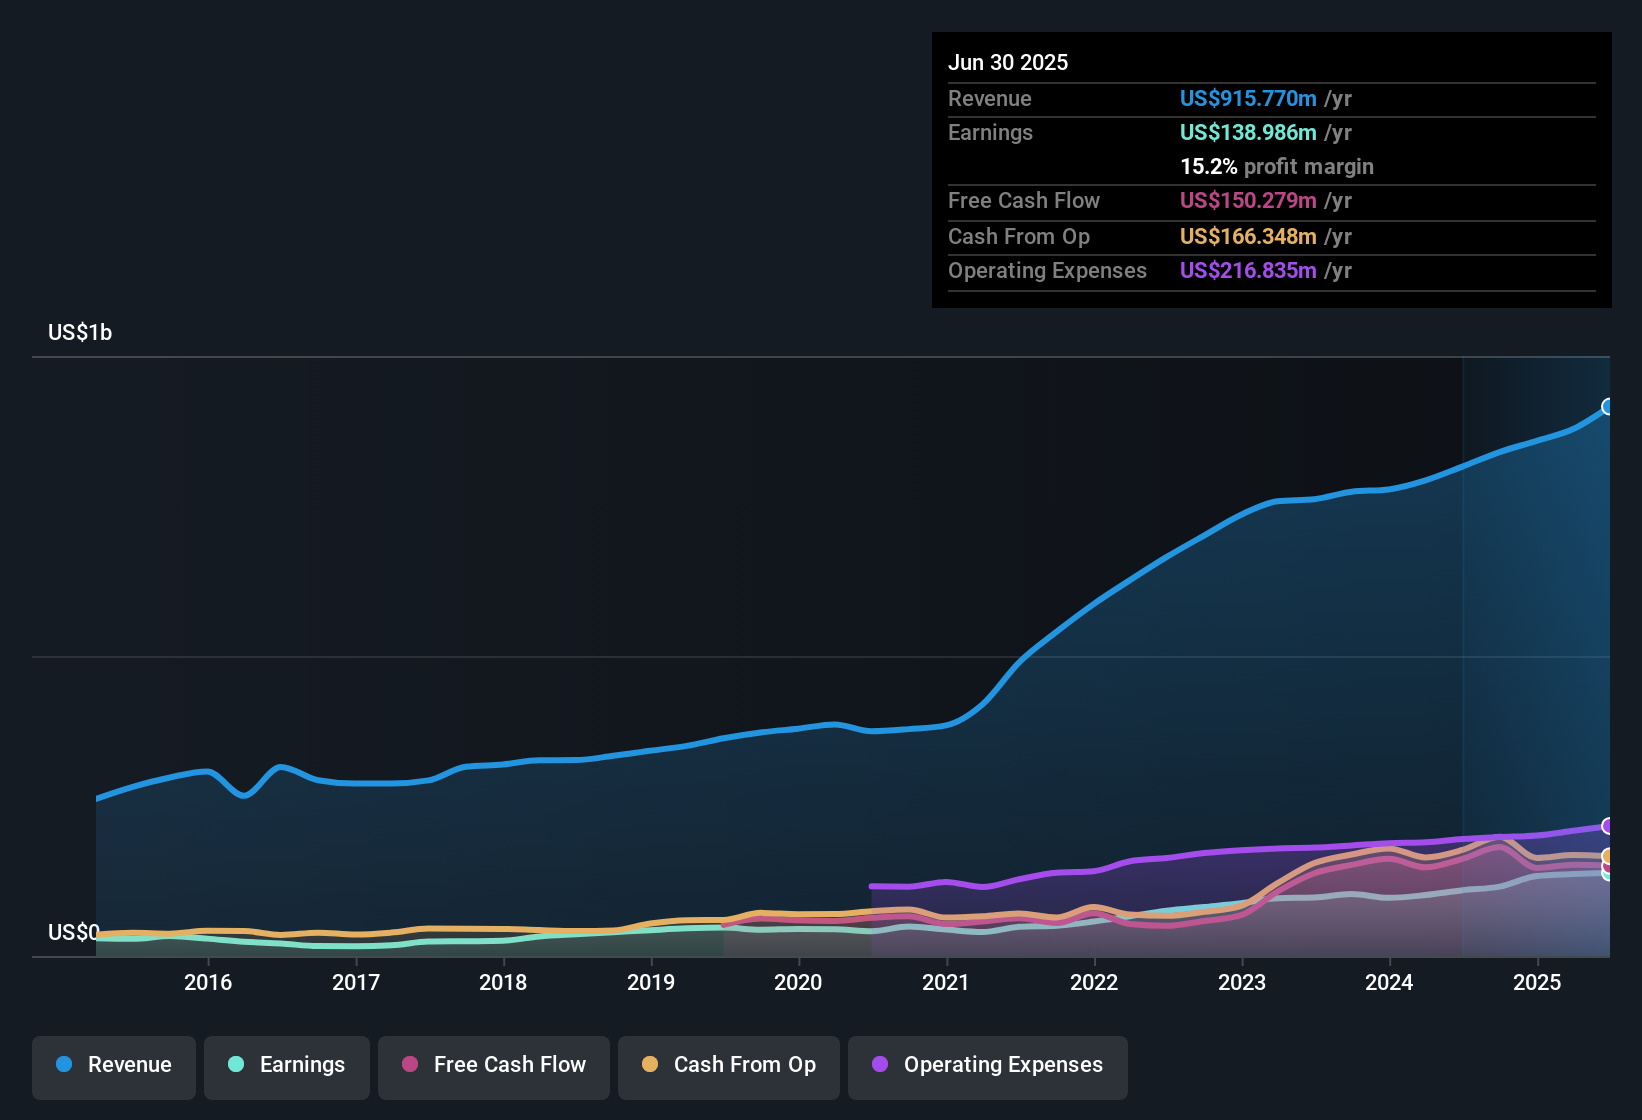
CSW Industrials (CSWI) has put up another solid quarter in Q3 2026, with quarterly context showing revenue moving from US$193.6 million in Q3 2025 to US$276.9 million in Q2 2026. EPS shifted from US$1.60 to US$2.42 over the same period, and trailing twelve month EPS reached US$8.55 on revenue of US$964.8 million. Over the last year, net income for the trailing twelve months rose from US$115.6 million to US$143.6 million as margins widened from 13.8% to 14.9%. This sets the scene for investors to focus on how durable this earnings profile looks as the latest results reset expectations for profitability.

See our full analysis for CSW Industrials.

With the headline numbers on the table, the next step is to see how this earnings run rate lines up against the prevailing narratives around CSW Industrials and to examine where the latest margin picture supports or challenges those views.

NYSE:CSW Earnings & Revenue History as at Jan 2026

Net margin edges up to 14.9%

  • Trailing twelve month net income sits at US$143.6 million on US$964.8 million of revenue, which works out to a 14.9% net margin compared with 13.8% a year earlier.
  • What stands out for the bullish view is that this 14.9% margin sits alongside trailing EPS of US$8.55, which links earnings quality to scale
    • Supporters often point to this kind of margin profile as consistent with a company that has some pricing power in its niches.
    • At the same time, the move from 13.8% to 14.9% shows that more of the US$964.8 million in sales is flowing through to the bottom line than a year ago.
To see how this margin profile fits into the bigger earnings story and valuation, have a look at how analysts frame the long term narrative for CSW Industrials. 📊 Read the full CSW Industrials Consensus Narrative.

Earnings growth outpaces revenue

  • Over the last 12 months, earnings grew 24.2% while revenue growth is cited at about 14.4% per year, so profit is rising faster than sales.
  • Supporters of a more bullish angle often argue that this gap between earnings and revenue growth suggests operating leverage
    • The trailing EPS figure of US$8.55 on US$143.6 million of net income reinforces the idea that the business is squeezing more profit out of each dollar of sales than it did a year ago.
    • Forecast earnings growth of about 16.2% per year is lower than the recent 24.2% pace, which gives bulls something to weigh when they think about how repeatable the last year has been.

Premium P/E versus industry

  • The shares trade on a trailing P/E of 34.5x, compared with 20.7x for the US Building industry and 27.5x for peers, and a referenced DCF fair value of US$196.61 sits below the recent share price of US$274.36.
  • Critics leaning bearish usually focus on this valuation premium and the gap to DCF fair value
    • The difference between the 34.5x P/E and the 20.7x industry average suggests the market is paying more per dollar of earnings than for many competitors, even though forecast earnings growth of about 16.2% per year is below the 5 year earnings CAGR of 23.7%.
    • The DCF fair value reference of US$196.61 compared with the share price of US$274.36 highlights how much optimism is already in the price, which bears see as leaving less room if future growth tracks closer to forecasts than to the past 5 year trend.

Next Steps

Don't just look at this quarter; the real story is in the long-term trend. We've done an in-depth analysis on CSW Industrials's growth and its valuation to see if today's price is a bargain. Add the company to your watchlist or portfolio now so you don't miss the next big move.

Explore Alternatives

CSW Industrials’ premium 34.5x P/E against lower industry multiples and a DCF fair value of US$196.61 versus a US$274.36 share price puts the spotlight on valuation risk.

If that kind of pricing makes you cautious, check out these 864 undervalued stocks based on cash flows to focus on companies where current prices look more aligned with underlying cash flow support.

This article by Simply Wall St is general in nature. We provide commentary based on historical data and analyst forecasts only using an unbiased methodology and our articles are not intended to be financial advice. It does not constitute a recommendation to buy or sell any stock, and does not take account of your objectives, or your financial situation. We aim to bring you long-term focused analysis driven by fundamental data. Note that our analysis may not factor in the latest price-sensitive company announcements or qualitative material. Simply Wall St has no position in any stocks mentioned.

Every question you ask will be answered
Scan the QR code to contact us
whatsapp
Also you can contact us via