CVB Financial (CVBF) just wrapped up FY 2025 with fourth quarter revenue of US$136.4 million and basic EPS of US$0.41, alongside quarterly net income of US$55.0 million. Over the last few quarters, the company has seen revenue move from US$126.8 million in Q4 2024 to US$136.4 million in Q4 2025, while quarterly EPS ranged from US$0.36 to US$0.41 over the same period. With a trailing twelve month net income of US$209.3 million and EPS of US$1.53, the latest release keeps the focus firmly on how efficiently CVB Financial is converting its revenue into profit margins.
See our full analysis for CVB Financial.
With the latest numbers on the table, the next step is to see how this earnings profile lines up against the prevailing narratives around CVB Financial and where those stories might need updating.
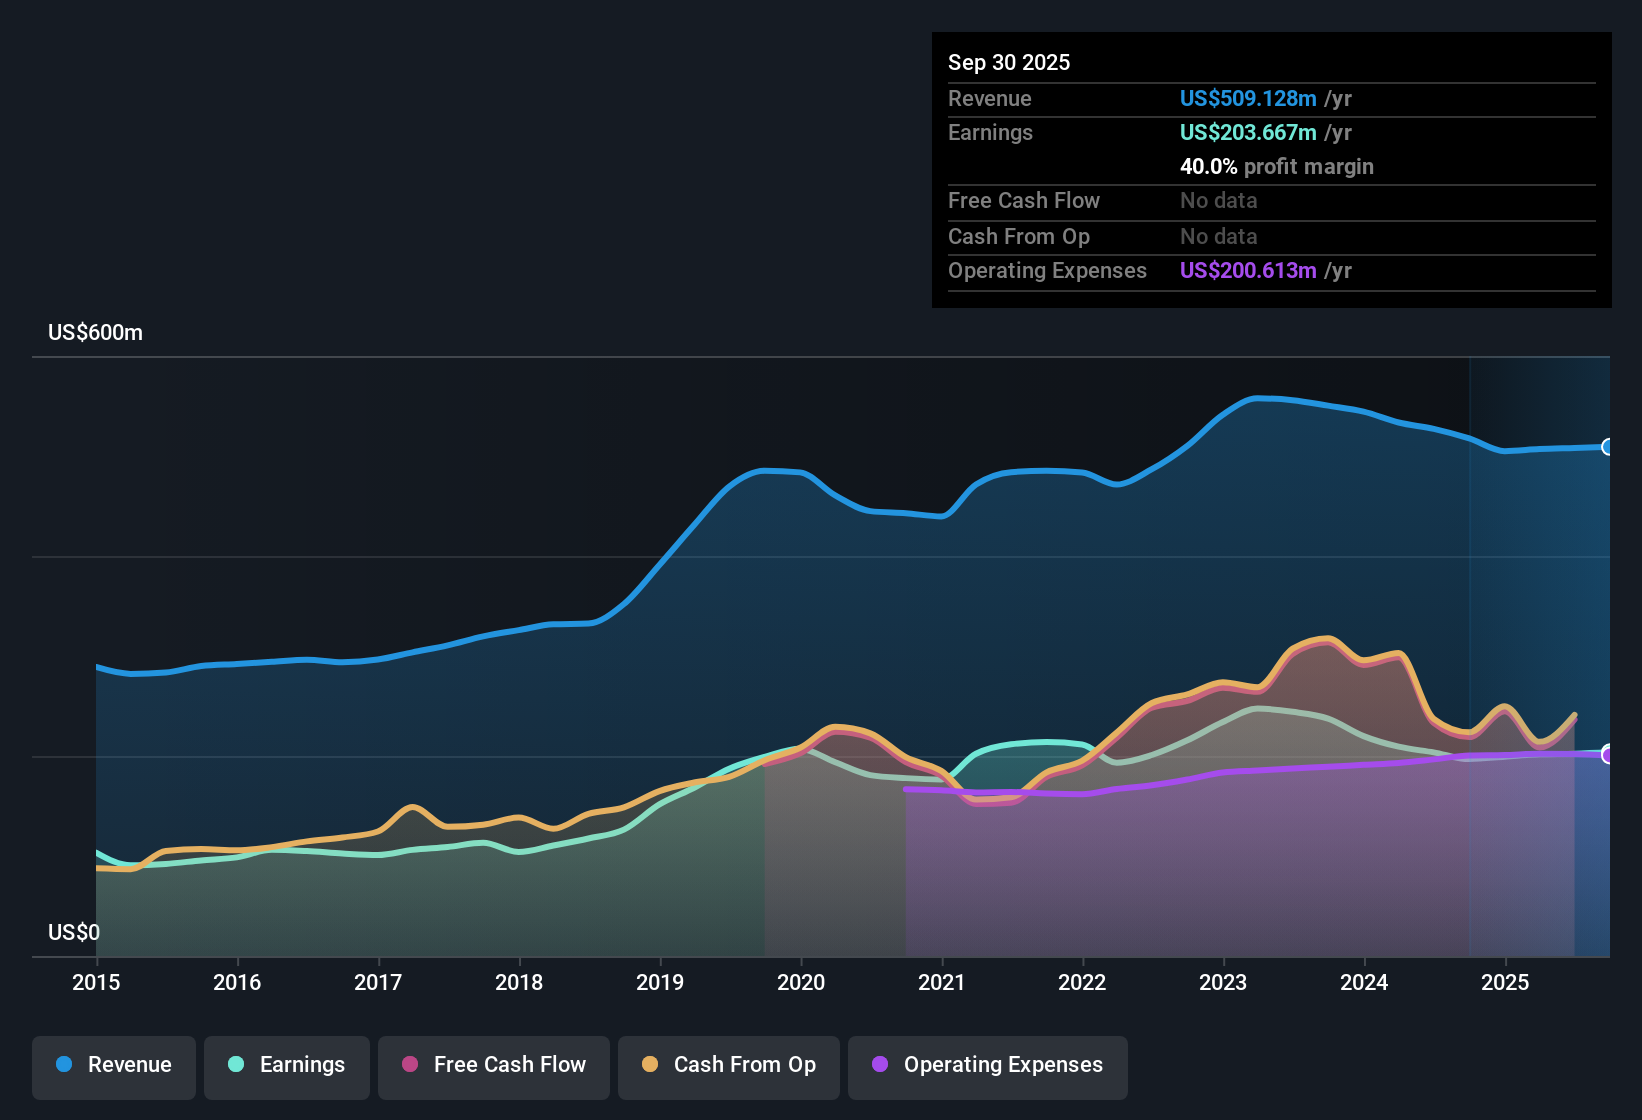
NasdaqGS:CVBF Earnings & Revenue History as at Jan 2026
3.36% net interest margin with tight cost control
On a trailing twelve month basis, CVB Financial reported a 3.36% net interest margin and a 46.03% cost to income ratio, with Q4 2025 itself at a 3.49% net interest margin and 46.31% cost to income ratio, pointing to solid spread income and fairly lean operating costs for a regional bank.
Bullish investors often highlight efficient, relationship banking models, and these figures give them specific support to point to:
Net interest margin moved from 3.31% in Q1 2025 to 3.49% in Q4 2025, while total revenue in that period ranged between US$126.4 million and US$136.4 million, which fits the view that the core lending and deposit franchise is earning a healthy spread.
Cost to income stayed clustered around the mid 40% area across 2025, between 45.55% and 46.69%, which lines up with the bullish idea of a bank that keeps overheads under control as it scales loan balances from US$8.4b in Q1 2025 to US$8.7b in Q4 2025.
Loan book growth with non performing loans at US$4.7 million
Total loans reached about US$8.7b at Q4 2025, compared with US$8.5b at Q4 2024, while non performing loans on a trailing basis are reported at US$4.7 million, at the low end of the US$21.9 million to US$27.8 million range seen in earlier periods in the dataset.
What is interesting for bullish commentators is how these credit quality figures sit alongside the growth story:
Trailing net profit of US$209.3 million comes with a 40.3% net profit margin, slightly above the 39.5% level a year earlier, which fits the positive view that earnings quality is high even as the loan book trends up.
Forecasts in the data show revenue expected to grow 21.6% per year and earnings 23.8% per year, while non performing loans in the latest quarter are US$4.7 million versus over US$20 million in several prior periods, which gives bulls numerical support that current asset quality is consistent with those higher growth expectations.
To see how the market is weighing this growth in loans against credit quality and long term profitability, check the full narrative that ties these numbers together.
📊 Read the full CVB Financial Consensus Narrative.
DCF fair value of US$31.47 vs. US$20.73 share price
The data show a DCF fair value of US$31.47 against a current share price of US$20.73, alongside a trailing P/E of 13.4x, a peer P/E average of 14.4x, a US Banks industry average P/E of 12.1x, and a dividend yield of 3.86%.
Critics who focus on valuation can point to the mixed signals in these numbers, and the figures help you see both sides:
On one hand, the 13.4x P/E is lower than the 14.4x peer average, and the 40.3% trailing net profit margin supports the idea that earnings quality backs that valuation, which some investors see as supportive of the DCF fair value being above the market price.
On the other hand, that same 13.4x P/E sits above the 12.1x US Banks industry average, so anyone taking a cautious view can argue the stock is priced above a broad industry yardstick even with a 3.86% dividend yield, which keeps the debate focused on how much weight to place on the DCF output versus simple multiples.
Next Steps
Don't just look at this quarter; the real story is in the long-term trend. We've done an in-depth analysis on CVB Financial's growth and its valuation to see if today's price is a bargain. Add the company to your watchlist or portfolio now so you don't miss the next big move.
See What Else Is Out There
CVB Financial’s valuation sits between peers and the broader US Banks group, which keeps questions open about how much upside the current price leaves.
If that kind of pricing debate makes you uneasy, check out these 876 undervalued stocks based on cash flows today to focus on ideas where the numbers look more clearly in your favor.
This article by Simply Wall St is general in nature. We provide commentary based on historical data and analyst forecasts only using an unbiased methodology and our articles are not intended to be financial advice. It does not constitute a recommendation to buy or sell any stock, and does not take account of your objectives, or your financial situation. We aim to bring you long-term focused analysis driven by fundamental data. Note that our analysis may not factor in the latest price-sensitive company announcements or qualitative material. Simply Wall St has no position in any stocks mentioned.